

Question: The dald in the below table are given for / patients with aplastic anemild. Patient number % reticulocytes Lymphocytes (per mm?) 1 3.6 1700 2
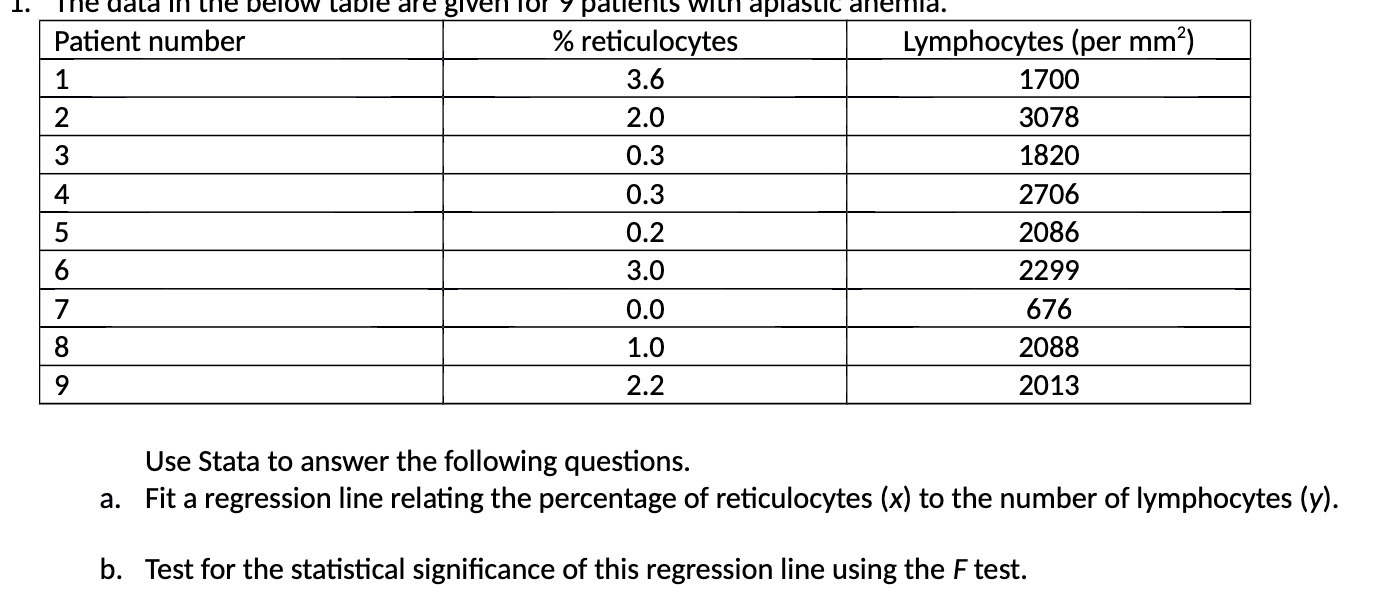
The dald in the below table are given for / patients with aplastic anemild. Patient number % reticulocytes Lymphocytes (per mm?) 1 3.6 1700 2 2.0 3078 3 0.3 1820 4 0.3 2706 5 0.2 2086 6 3.0 2299 7 0.0 676 8 1.0 2088 9 2.2 2013 Use Stata to answer the following questions. a. Fit a regression line relating the percentage of reticulocytes (x) to the number of lymphocytes (y). b. Test for the statistical significance of this regression line using the F test
Step by Step Solution
There are 3 Steps involved in it
1 Expert Approved Answer
Step: 1 Unlock

Question Has Been Solved by an Expert!
Get step-by-step solutions from verified subject matter experts
Step: 2 Unlock
Step: 3 Unlock