

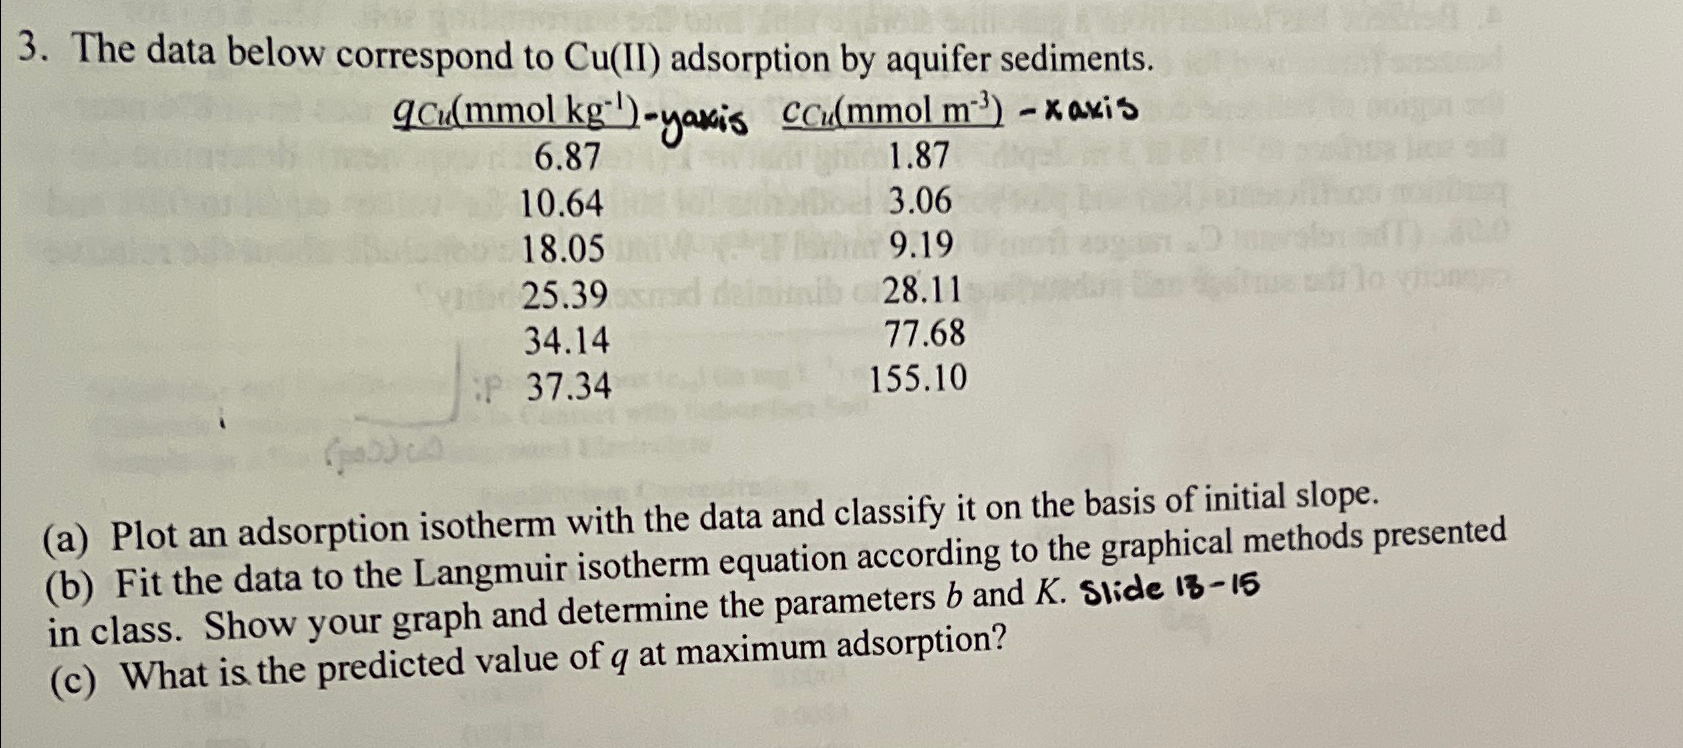
Question: The data below correspond to C u ( I I ) adsorption by aquifer sediments. table [ [ q C u ( m m
The data below correspond to adsorption by aquifer sediments.
tableyaxis, xaxis
a Plot an adsorption isotherm with the data and classify it on the basis of initial slope.
b Fit the data to the Langmuir isotherm equation according to the graphical methods presented in class. Show your graph and determine the parameters and
c What is the predicted value of at maximum adsorption?
Step by Step Solution
There are 3 Steps involved in it
1 Expert Approved Answer
Step: 1 Unlock

Question Has Been Solved by an Expert!
Get step-by-step solutions from verified subject matter experts
Step: 2 Unlock
Step: 3 Unlock