

Question: The data below is based on the visitation at a national park please interpret and explain the ME, MAPE and the MAD in reference to
The data below is based on the visitation at a national park please interpret and explain the ME, MAPE and the MAD in reference to park attendance. Please do not give me the definition of ME, MAPE and the MAD. Please explain, if you can what that means to the attendance of this national park.
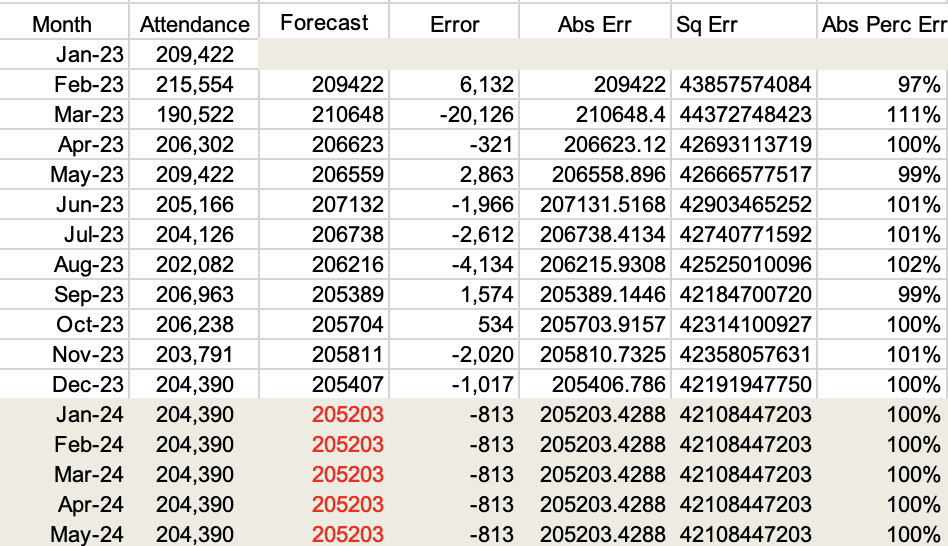
\begin{tabular}{|r|r|r|r|r|r|r|} \hline Month & Attendance & Forecast & Error & Abs Err & Sq Err & Abs Perc Err \\ \hline Jan-23 & 209,422 & & & & & \\ \hline Feb-23 & 215,554 & 209422 & 6,132 & 209422 & 43857574084 & 97% \\ \hline Mar-23 & 190,522 & 210648 & 20,126 & 210648.4 & 44372748423 & 111% \\ \hline Apr-23 & 206,302 & 206623 & -321 & 206623.12 & 42693113719 & 100% \\ \hline May-23 & 209,422 & 206559 & 2,863 & 206558.896 & 42666577517 & 99% \\ \hline Jun-23 & 205,166 & 207132 & 1,966 & 207131.5168 & 42903465252 & 101% \\ \hline Jul-23 & 204,126 & 206738 & 2,612 & 206738.4134 & 42740771592 & 101% \\ \hline Aug-23 & 202,082 & 206216 & 4,134 & 206215.9308 & 42525010096 & 102% \\ \hline Sep-23 & 206,963 & 205389 & 1,574 & 205389.1446 & 42184700720 & 99% \\ \hline Oct-23 & 206,238 & 205704 & 534 & 205703.9157 & 42314100927 & 100% \\ \hline Nov-23 & 203,791 & 205811 & 2,020 & 205810.7325 & 42358057631 & 101% \\ \hline Dec-23 & 204,390 & 205407 & 1,017 & 205406.786 & 42191947750 & 100% \\ \hline Jan-24 & 204,390 & 205203 & -813 & 205203.4288 & 42108447203 & 100% \\ \hline Feb-24 & 204,390 & 205203 & -813 & 205203.4288 & 42108447203 & 100% \\ \hline Mar-24 & 204,390 & 205203 & -813 & 205203.4288 & 42108447203 & 100% \\ \hline Apr-24 & 204,390 & 205203 & -813 & 205203.4288 & 42108447203 & 100% \\ \hline May-24 & 204,390 & 205203 & -813 & 205203.4288 & 42108447203 & 100% \\ \hline \end{tabular} \begin{tabular}{|r|r|r|r|r|r|r|} \hline Month & Attendance & Forecast & Error & Abs Err & Sq Err & Abs Perc Err \\ \hline Jan-23 & 209,422 & & & & & \\ \hline Feb-23 & 215,554 & 209422 & 6,132 & 209422 & 43857574084 & 97% \\ \hline Mar-23 & 190,522 & 210648 & 20,126 & 210648.4 & 44372748423 & 111% \\ \hline Apr-23 & 206,302 & 206623 & -321 & 206623.12 & 42693113719 & 100% \\ \hline May-23 & 209,422 & 206559 & 2,863 & 206558.896 & 42666577517 & 99% \\ \hline Jun-23 & 205,166 & 207132 & 1,966 & 207131.5168 & 42903465252 & 101% \\ \hline Jul-23 & 204,126 & 206738 & 2,612 & 206738.4134 & 42740771592 & 101% \\ \hline Aug-23 & 202,082 & 206216 & 4,134 & 206215.9308 & 42525010096 & 102% \\ \hline Sep-23 & 206,963 & 205389 & 1,574 & 205389.1446 & 42184700720 & 99% \\ \hline Oct-23 & 206,238 & 205704 & 534 & 205703.9157 & 42314100927 & 100% \\ \hline Nov-23 & 203,791 & 205811 & 2,020 & 205810.7325 & 42358057631 & 101% \\ \hline Dec-23 & 204,390 & 205407 & 1,017 & 205406.786 & 42191947750 & 100% \\ \hline Jan-24 & 204,390 & 205203 & -813 & 205203.4288 & 42108447203 & 100% \\ \hline Feb-24 & 204,390 & 205203 & -813 & 205203.4288 & 42108447203 & 100% \\ \hline Mar-24 & 204,390 & 205203 & -813 & 205203.4288 & 42108447203 & 100% \\ \hline Apr-24 & 204,390 & 205203 & -813 & 205203.4288 & 42108447203 & 100% \\ \hline May-24 & 204,390 & 205203 & -813 & 205203.4288 & 42108447203 & 100% \\ \hline \end{tabular}
Step by Step Solution
There are 3 Steps involved in it

Get step-by-step solutions from verified subject matter experts