

Question: The data below obtained from a hydrogen fuel cell experiment at 4 0 degree Celsius, 0 . 5 SLPM for each of hydrogen gas and
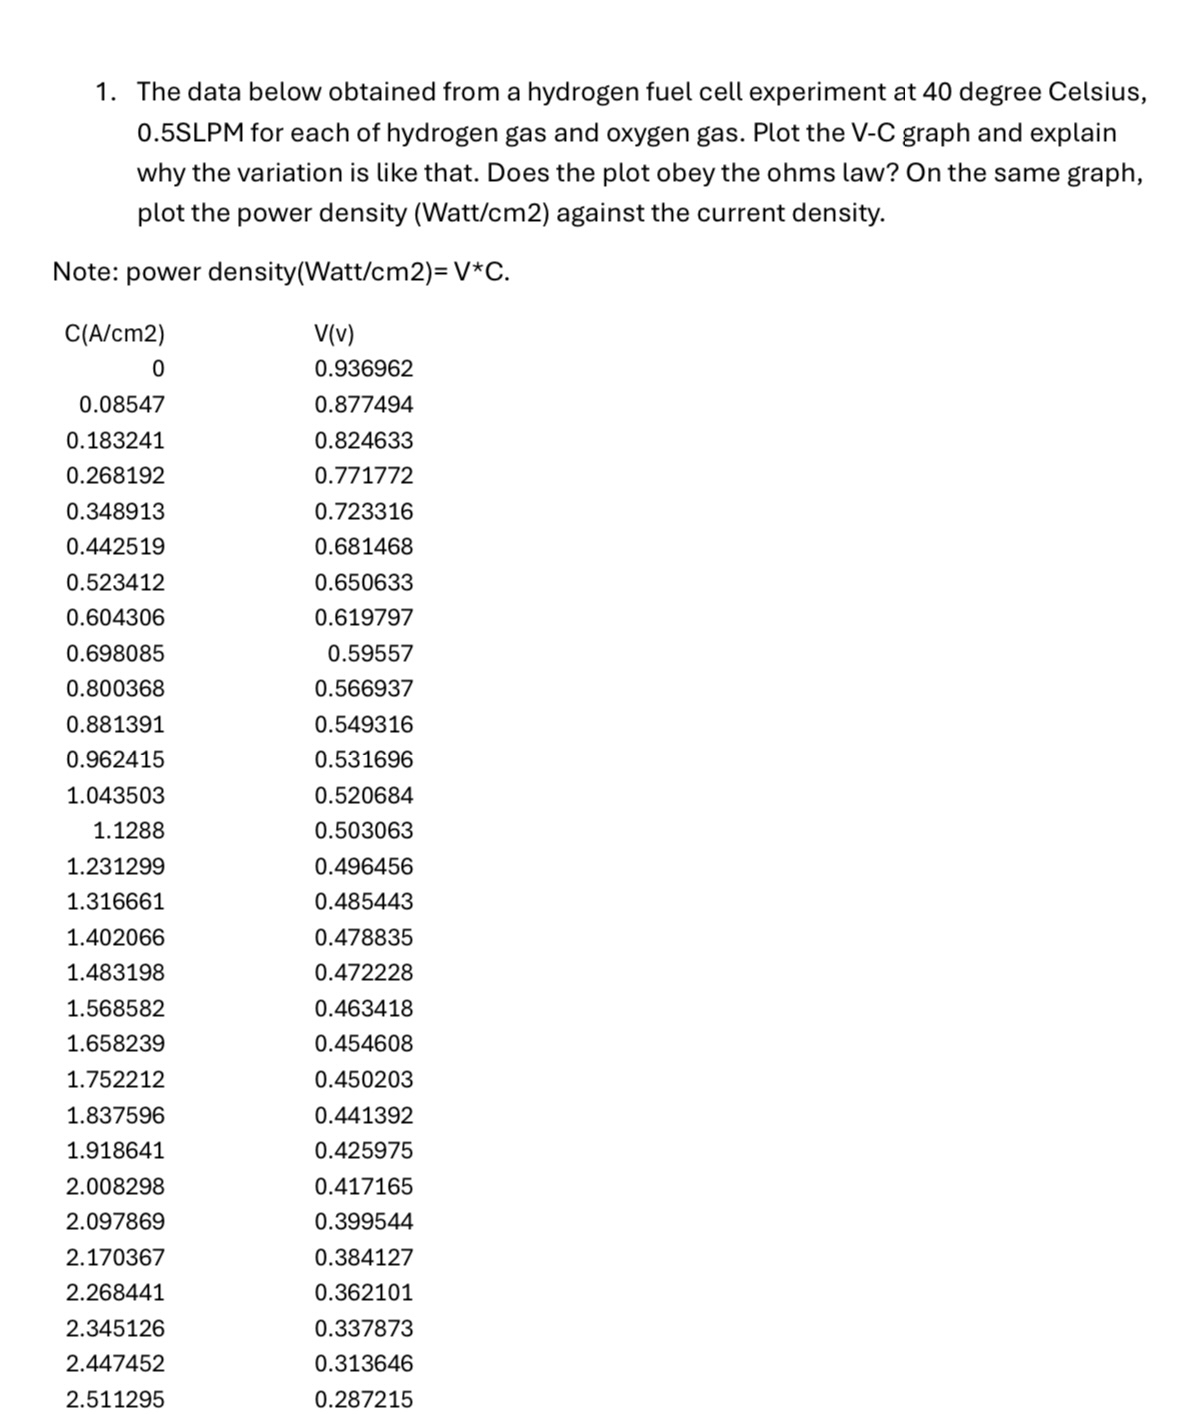
The data below obtained from a hydrogen fuel cell experiment at degree Celsius,
SLPM for each of hydrogen gas and oxygen gas. Plot the VC graph and explain
why the variation is like that. Does the plot obey the ohms law? On the same graph,
plot the power density Wattcm against the current density.
Note: power densityWattcm VC
Step by Step Solution
There are 3 Steps involved in it
1 Expert Approved Answer
Step: 1 Unlock

Question Has Been Solved by an Expert!
Get step-by-step solutions from verified subject matter experts
Step: 2 Unlock
Step: 3 Unlock