

Question: The data below represent precision length measurements of 80 consecutive structural frame members coming off the assembly line. Sample # x1 x2 *3 x4 Sample

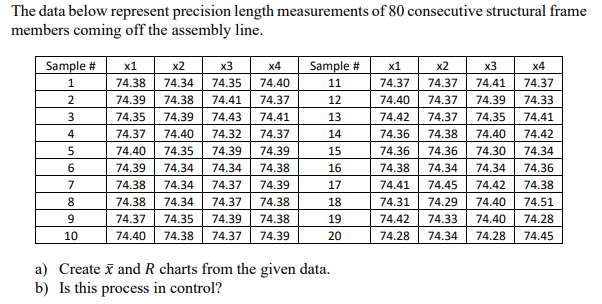
The data below represent precision length measurements of 80 consecutive structural frame members coming off the assembly line. Sample # x1 x2 *3 x4 Sample # x1 x2 x4 1 74.38 74.34 74.35 74.40 11 74.37 74.37 74.41 74.37 2 74.39 74.38 74.41 74.37 12 74.40 74.37 74.39 74.33 3 74.35 74.39 74.43 74.41 13 74.42 74.37 74.35 74.41 4 74.37 74.40 74.32 74.37 14 74.36 74.38 74.40 74.42 5 74.40 74.35 74.39 74.39 15 74.36 74.36 74.30 74.34 6 74.39 74.34 74.34 74.38 16 74.38 74.34 74.34 74.36 7 74.38 74.34 74.37 74.39 17 74.41 74.45 74.42 74.38 8 74.38 74.34 74.37 74.38 18 74.31 74.29 74.40 74.51 LO 74.37 74.35 74.39 74.38 19 74.42 74.33 74.40 74.28 10 74.40 74.38 74.37 74.39 20 74.28 74.34 74.28 74.45 a) Create x and R charts from the given data. b) Is this process in control
Step by Step Solution
There are 3 Steps involved in it

Get step-by-step solutions from verified subject matter experts