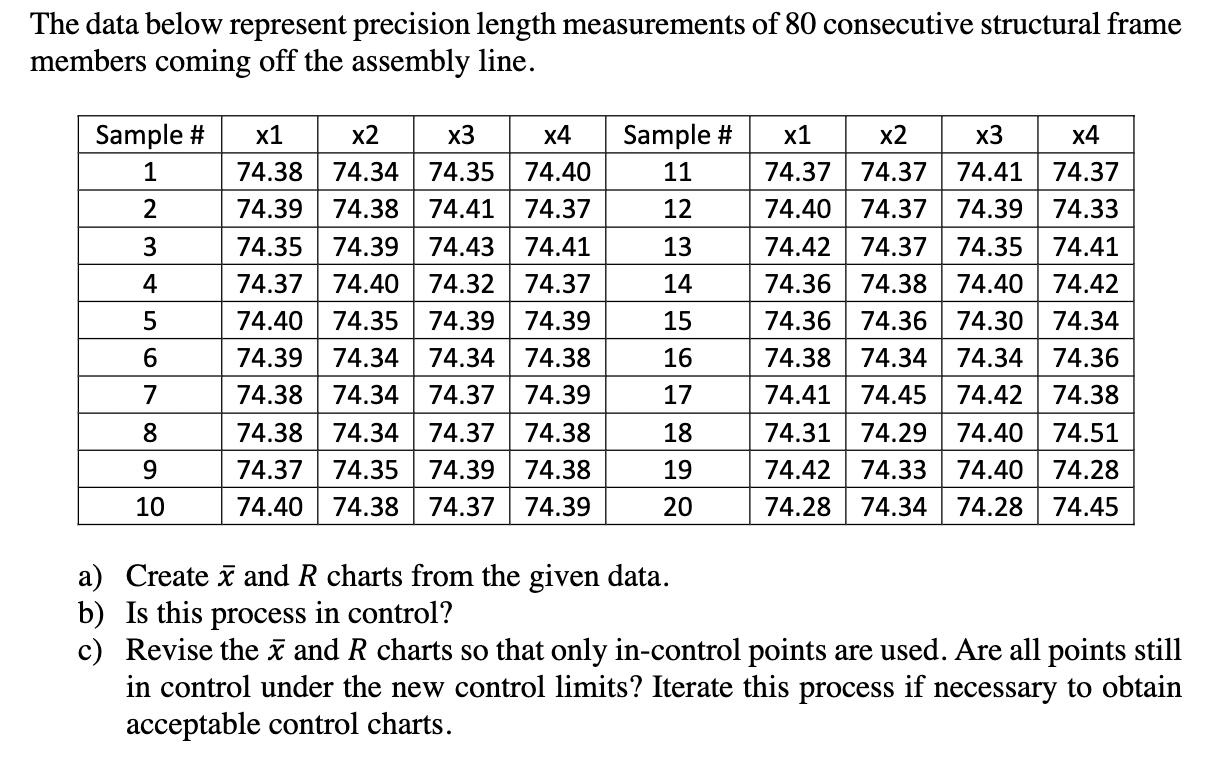
Question: The data below represent precision length measurements of 80 consecutive structural frame members coming off the assembly line. Sample # 1 Sample # 11 2

The data below represent precision length

The data below represent precision length measurements of 80 consecutive structural frame members coming off the assembly line. Sample # 1 Sample # 11 2 12 3 13 4 14 5 x1 74.38 74.39 74.35 74.37 74.40 74.39 74.38 74.38 74.37 74.40 X2 74.34 74.38 74.39 74.40 74.35 74.34 74.34 74.34 74.35 74.38 x3 74.35 74.41 74.43 74.32 74.39 74.34 74.37 74.37 74.39 74.37 X4 74.40 74.37 74.41 74.37 74.39 74.38 74.39 74.38 74.38 74.39 15 x1 74.37 74.40 74.42 74.36 74.36 74.38 74.41 74.31 74.42 74.28 x2 x3 X4 74.37 74.41 74.37 74.37 74.39 74.33 74.37 74.35 74.41 74.38 74.40 74.42 74.36 74.30 74.34 74.34 74.34 74.36 74.45 74.42 74.38 74.29 74.40 74.51 74.33 74.40 74.28 74.34 74.28 74.45 6 16 7 8 9 10 17 18 19 20 a) Create and R charts from the given data. b) Is this process in control? c) Revise the and R charts so that only in-control points are used. Are all points still in control under the new control limits? Iterate this process if necessary to obtain acceptable control charts

Step by Step Solution

There are 3 Steps involved in it

1 Expert Approved Answer
Step: 1 Unlock blur-text-image
Question Has Been Solved by an Expert!

Get step-by-step solutions from verified subject matter experts

Step: 2 Unlock
Step: 3 Unlock

Students Have Also Explored These Related General Management Questions!