

Question: The data below represents a spreadsheet of observed data for a variable X for a three year period from July 13 to June 16 (
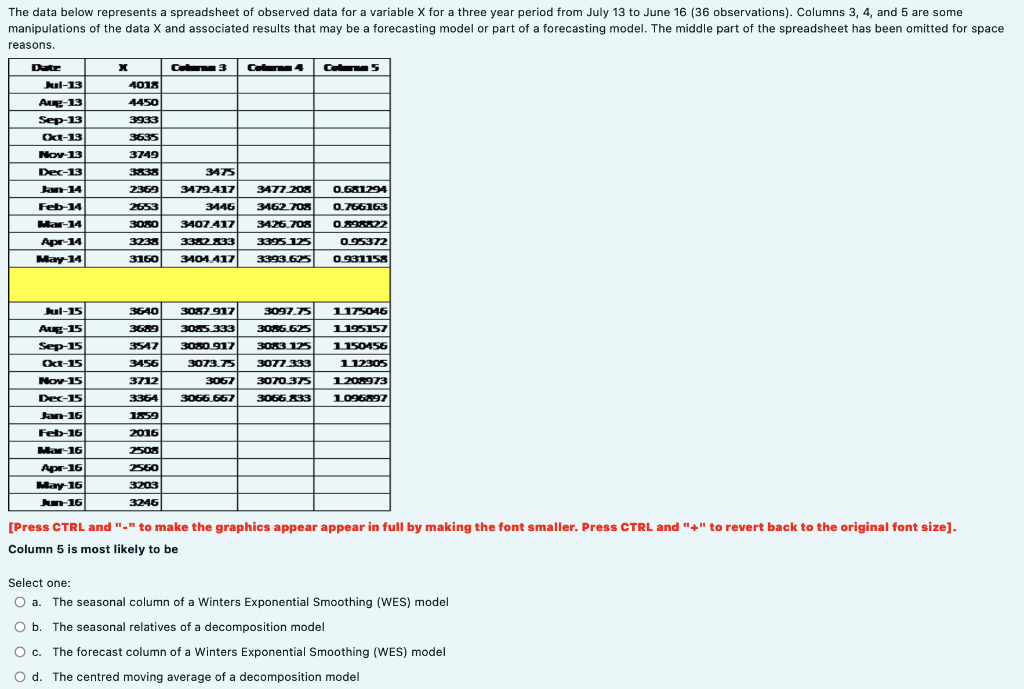
The data below represents a spreadsheet of observed data for a variable X for a three year period from July 13 to June 16 ( 36 observations). Columns 3,4 , and 5 are some reasons. [Press CTRL and "_" to make the graphics appear appear in full by making the font smaller. Press CTRL and " + " to revert back to the original font size]. Column 5 is most likely to be Select one: a. The seasonal column of a Winters Exponential Smoothing (WES) model b. The seasonal relatives of a decomposition model c. The forecast column of a Winters Exponential Smoothing (WES) model d. The centred moving average of a decomposition model
Step by Step Solution
There are 3 Steps involved in it
1 Expert Approved Answer
Step: 1 Unlock

Question Has Been Solved by an Expert!
Get step-by-step solutions from verified subject matter experts
Step: 2 Unlock
Step: 3 Unlock