

Question: The data below show the hourly wages earned by six employees. The second column shows the number of years of work experience for each
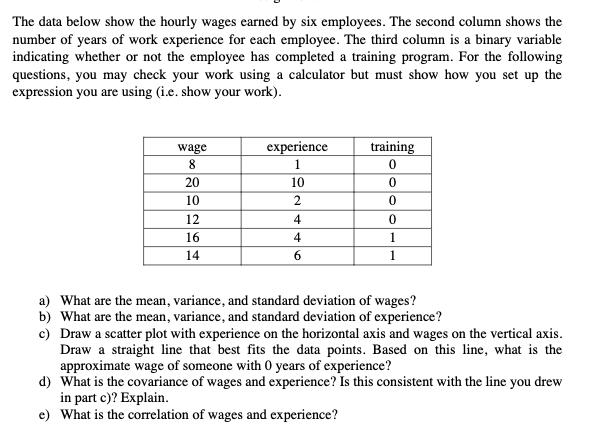
The data below show the hourly wages earned by six employees. The second column shows the number of years of work experience for each employee. The third column is a binary variable indicating whether or not the employee has completed a training program. For the following questions, you may check your work using a calculator but must show how you set up the expression you are using (i.e. show your work). wage 8 20 10 12 16 14 experience 1 10 2 4 4 6 training 0 0 0 0 1 1 a) What are the mean, variance, and standard deviation of wages? b) What are the mean, variance, and standard deviation of experience? c) Draw a scatter plot with experience on the horizontal axis and wages on the vertical axis. Draw a straight line that best fits the data points. Based on this line, what is the approximate wage of someone with 0 years of experience? d) What is the covariance of wages and experience? Is this consistent with the line you drew in part c)? Explain. e) What is the correlation of wages and experience?
Step by Step Solution
3.38 Rating (154 Votes )
There are 3 Steps involved in it

Get step-by-step solutions from verified subject matter experts