

Question: The data collected is shown in the table below: a. In Exeel, run at time series regression and paste the summary output to your answers.
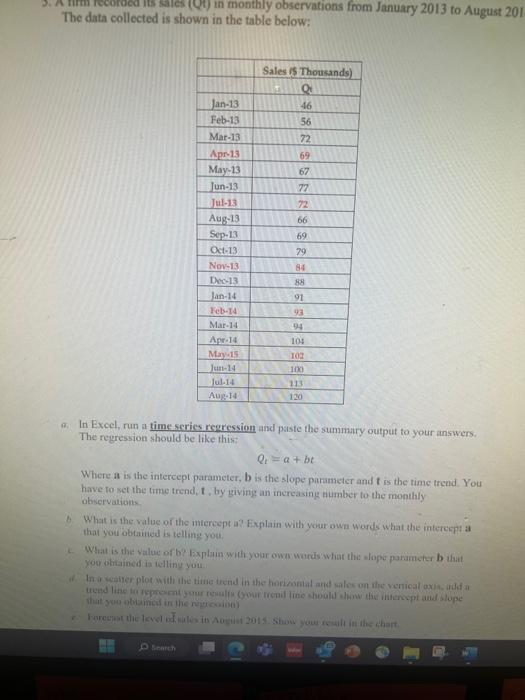
The data collected is shown in the table below: a. In Exeel, run at time series regression and paste the summary output to your answers. The regression should be like this: Qt=a+bt Where a is the intereept parameter, b is the slope parameter and t is the time trend. You have ro set the time trend, t, by giving an increasing aumber to the monthly observations. b. What is the value of the imtereept a? Explain with your own words what the interecpl a that you obtained is telling you? 4. What is the value of by Explain with your own wurdewhar the slope parameter b that you ohilained io ielliny you. The data collected is shown in the table below: a. In Exeel, run at time series regression and paste the summary output to your answers. The regression should be like this: Qt=a+bt Where a is the intereept parameter, b is the slope parameter and t is the time trend. You have ro set the time trend, t, by giving an increasing aumber to the monthly observations. b. What is the value of the imtereept a? Explain with your own words what the interecpl a that you obtained is telling you? 4. What is the value of by Explain with your own wurdewhar the slope parameter b that you ohilained io ielliny you
Step by Step Solution
There are 3 Steps involved in it

Get step-by-step solutions from verified subject matter experts