

Question: The data contained in the DATAfile named CocaCola show the monthly percentage returns the S&P 500 and the Coca-Cola Company for August 2015 to
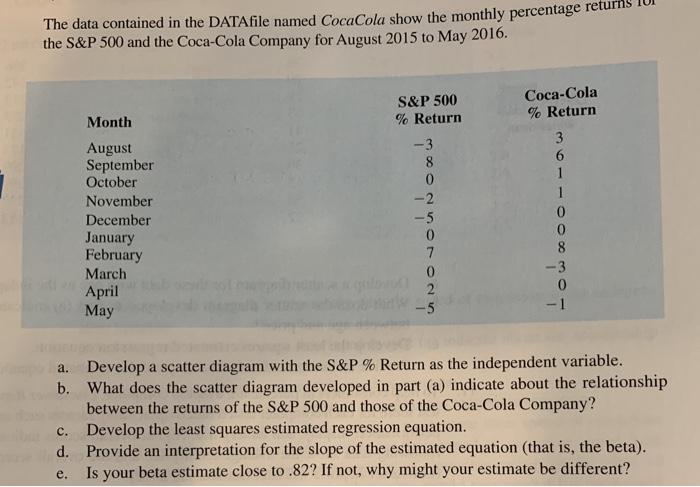
The data contained in the DATAfile named CocaCola show the monthly percentage returns the S&P 500 and the Coca-Cola Company for August 2015 to May 2016. Month S&P 500 % Return Coca-Cola % Return August -3 3 6 September 8 1 October 0 November -2 1 December -5 0 January 0 0 February 7 8 March 0 -3 2 0 -5 T April May a. Develop a scatter diagram with the S&P % Return as the independent variable. b. What does the scatter diagram developed in part (a) indicate about the relationship between the returns of the S&P 500 and those of the Coca-Cola Company? c. Develop the least squares estimated regression equation. d. Provide an interpretation for the slope of the estimated equation (that is, the beta). e. Is your beta estimate close to .82? If not, why might your estimate be different?
Step by Step Solution
There are 3 Steps involved in it

Get step-by-step solutions from verified subject matter experts