

Question: The data for this question are for each 30 stores of a grocery supermarket in U.K. The variables (Y, X1 to X5) are as
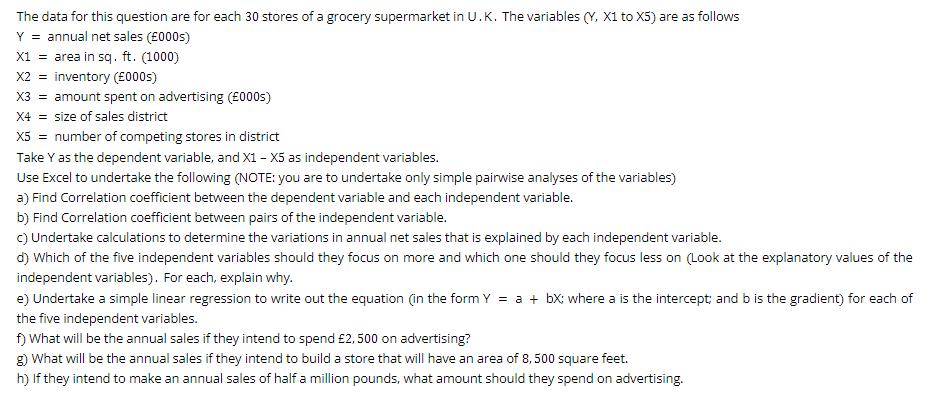
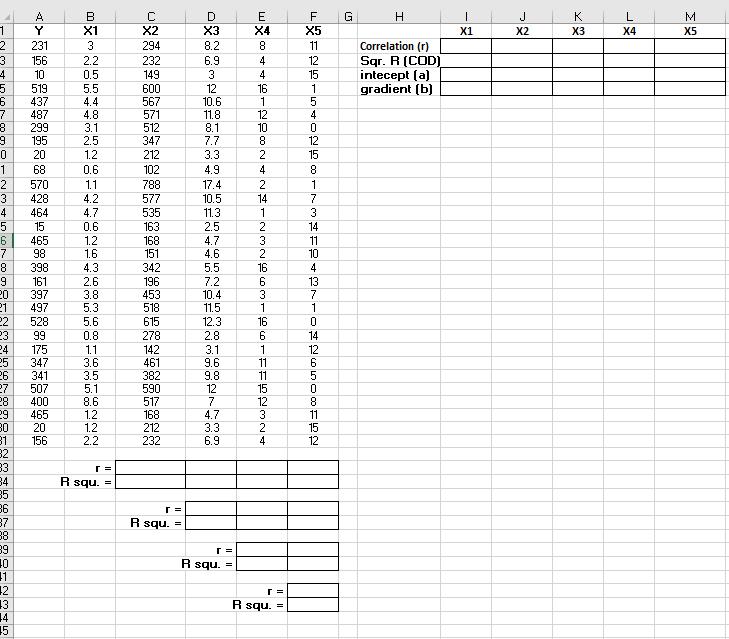
The data for this question are for each 30 stores of a grocery supermarket in U.K. The variables (Y, X1 to X5) are as follows Y = annual net sales (000s) X1 = area in sq. ft. (1000) X2 = inventory (E000s) X3 = amount spent on advertising (000s) X4 = size of sales district XS = number of competing stores in district Take Y as the dependent variable, and X1 - X5 as independent variables. Use Excel to undertake the following (NOTE: you are to undertake only simple pairwise analyses of the variables) a) Find Correlation coefficient between the dependent variable and each independent variable. b) Find Correlation coefficient between pairs of the independent variable. c) Undertake calculations to determine the variations in annual net sales that is explained by each independent variable. d) Which of the five independent variables should they focus on more and which one should they focus less on (Look at the explanatory values of the independent variables). For each, explain why. e) Undertake a simple linear regression to write out the equation (in the form Y = a + bX; where a is the intercept; and b is the gradient) for each of the five independent variables. f) What will be the annual sales if they intend to spend 2,500 on advertising? g) What will be the annual sales if they intend to build a store that will have an area of 8,500 square feet. h) If they intend to make an annual sales of half a million pounds, what amount should they spend on advertising. A 1 2 3 4 5 6 7 3 g. 0 1 2 3 4 5 B 7 8 9 20 21 22 23 24 2.5 26 27 28 29 30 31 2345 6 7 8 39 10 353246 BW3 AY 23 18 10 53 52 2 29 15 20 8 50 28 +45 458 28132 528 9 532340 40 45 20 158 2.2 0.5 5.5 4.4 4.8 31 2.5 1.2 0.6 1.1 4.2 4.7 0.6 1.2 1.6 4.3 2.6 3.8 5.3 5.6 0.8 1.1 3.6 3.5 5.1 86 1.2 1.2 2.2 r= R squ. = 2 20 R squ. 11 D X3 82 69 3 12 10.6 11.8 81 7.7 3.3 4.9 17.4 10.5 11.3 2.5 4.7 46 5.5 7.2 10.4 11.5 12.3 2.8 31 96 98 12 7 47 3.3 6.9 r= ||||| R squ. = E a 8 4 4 16 1 12 11 8 2 4 2 1 412326631 L6 104 11 11 52324 = F5 1 25 15402 15 R_squ. = 8 1 7 3 14 13 7 1 0 14 12 6 5 0 8 1512 G I | Correlation (r) Sqr. R (COD) intecept (a] gradient (b) 1 X1 J 2 K X3 L X4
Step by Step Solution
There are 3 Steps involved in it

Get step-by-step solutions from verified subject matter experts