

Question: The data from car crash tests for four different vehicle size categories (Small, Midsize, Large, and SUV) with measured amounts of left leg femur
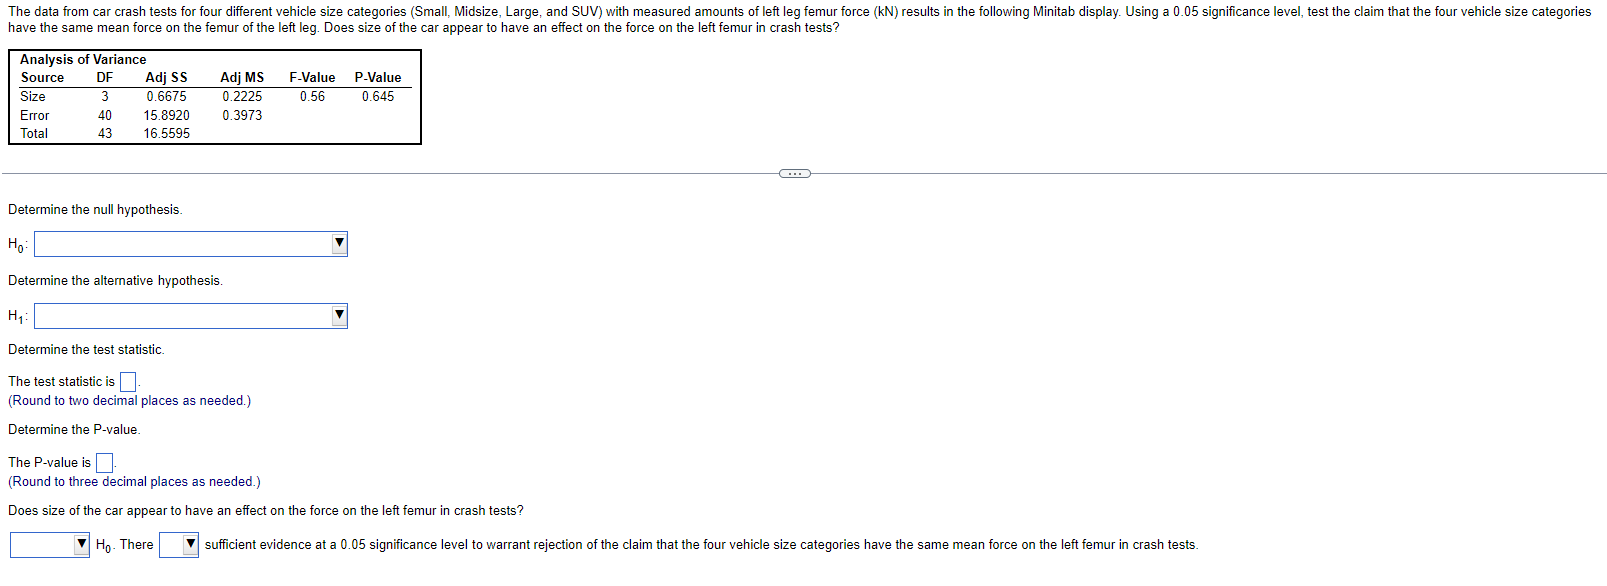
The data from car crash tests for four different vehicle size categories (Small, Midsize, Large, and SUV) with measured amounts of left leg femur force (kN) results in the following Minitab display. Using a 0.05 significance level, test the claim that the four vehicle size categories have the same mean force on the femur of the left leg. Does size of the car appear to have an effect on the force on the left femur in crash tests? Analysis of Variance Source DF Adj SS Size 3 0.6675 Adj MS 0.2225 F-Value P-Value 0.56 0.645 Error Total 40 15.8920 0.3973 43 16.5595 Determine the null hypothesis. Ho Determine the alternative hypothesis. H Determine the test statistic. The test statistic is (Round to two decimal places as needed.) Determine the P-value. The P-value is (Round to three decimal places as needed.) Does size of the car appear to have an effect on the force on the left femur in crash tests? Ho. There sufficient evidence at a 0.05 significance level to warrant rejection of the claim that the four vehicle size categories have the same mean force on the left femur in crash tests.
Step by Step Solution
There are 3 Steps involved in it
H0 SmallMidsizeL... View full answer

Get step-by-step solutions from verified subject matter experts