

Question: The data from car crash tests for four different vehicle size categories (Small, Midsize, Large, and SUV) with measured amounts of left leg femur force
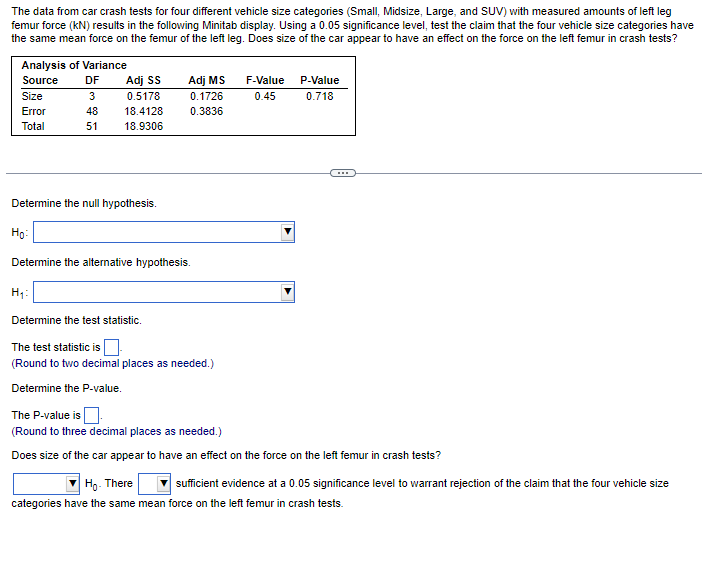


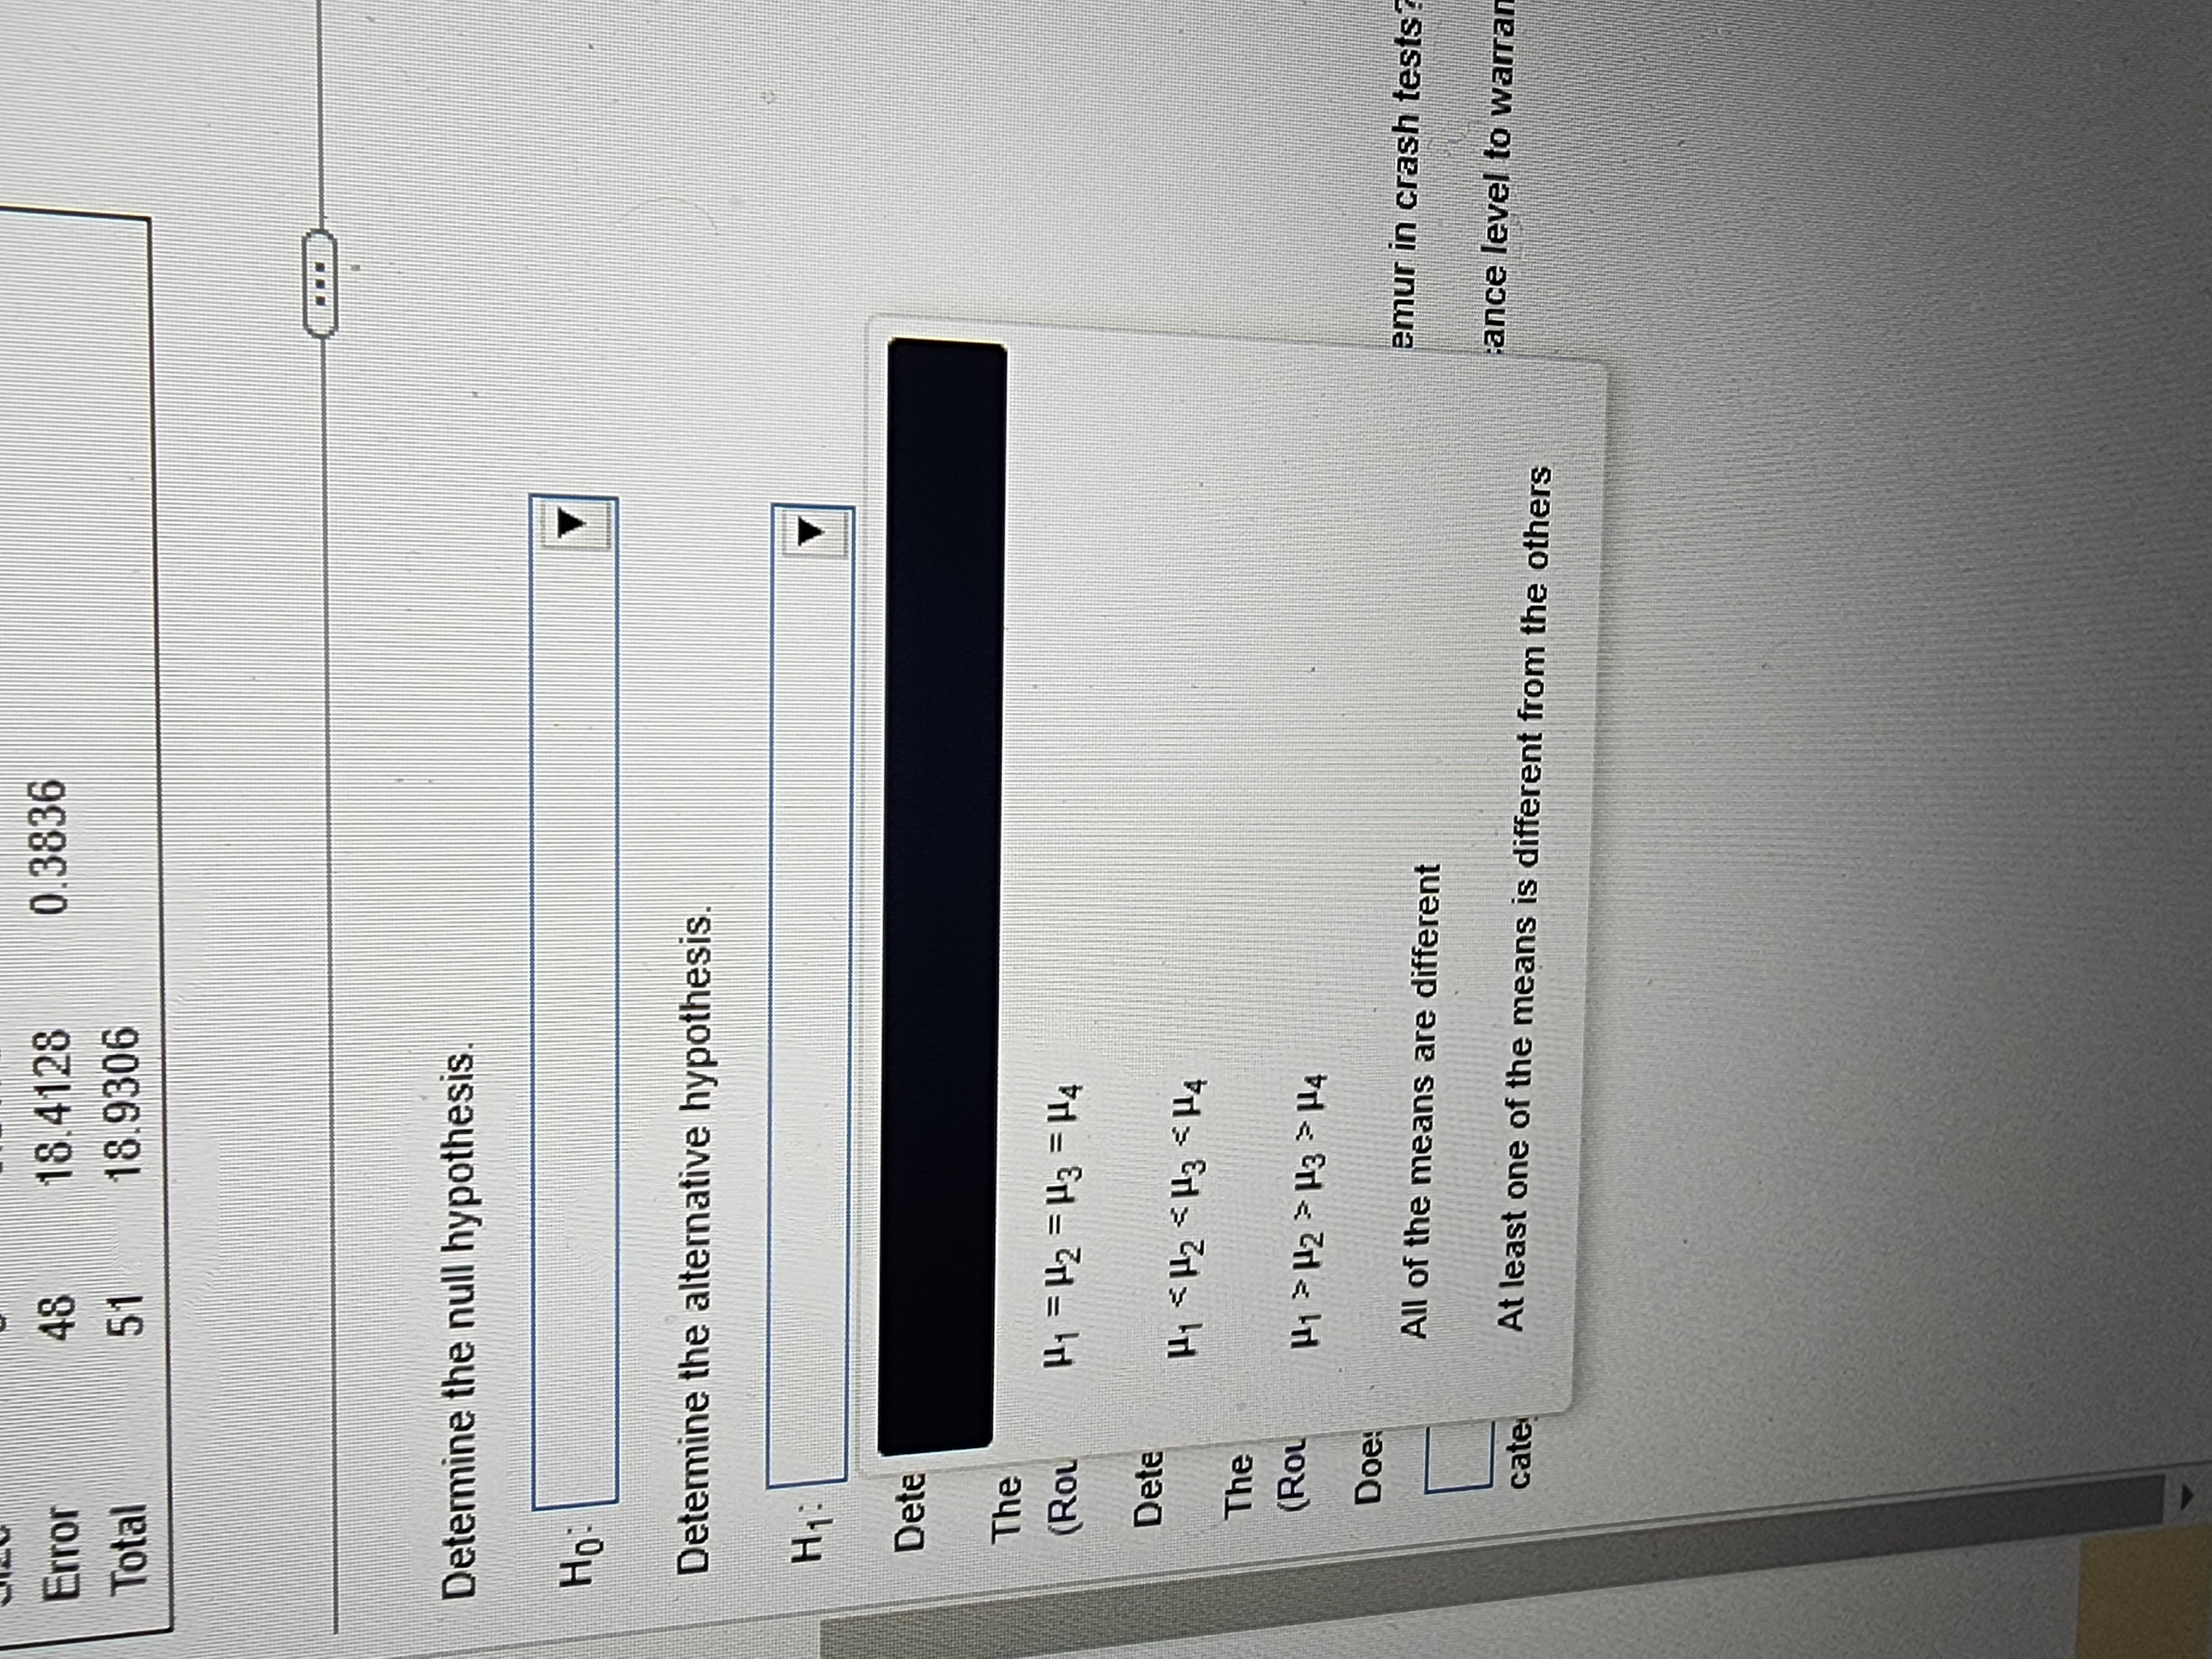
The data from car crash tests for four different vehicle size categories (Small, Midsize, Large, and SUV) with measured amounts of left leg femur force (KN) results in the following Minitab display. Using a 0.05 significance level, test the claim that the four vehicle size categories have the same mean force on the femur of the left leg. Does size of the car appear to have an effect on the force on the left femur in crash tests? Analysis of Variance Source OF Adj SS Adj MS F-Value P-Value Size 3 0.5178 0. 1726 0.45 0.718 Error 48 18.4128 0.3836 Total 51 18.9306 Determine the null hypothesis. Ho: Determine the alternative hypothesis. Determine the test statistic. The test statistic is (Round to two decimal places as needed.) Determine the P-value. The P-value is. (Round to three decimal places as needed.) Does size of the car appear to have an effect on the force on the left femur in crash tests? Ho- There sufficient evidence at a 0.05 significance level to warrant rejection of the claim that the four vehicle size categories have the same mean force on the left femur in crash tests.Error 48 18 4128 0.3836 Total 51 18.9306 Determine the null hypothesis. Ho Determine the alternative hypothesis. H1 : Dete The (ROL H1 = H2 = H3 = H4 Dete H1 - H2 H2 > H3 > H4 Does emur in crash tests All of the means are different ance level to warran cate At least one of the means is different from the others
Step by Step Solution
There are 3 Steps involved in it

Get step-by-step solutions from verified subject matter experts