

Question: The data from car crash tests for four different vehicle size categories (Small, Midsize, Large, and SUV) with measured amounts of left leg femur force
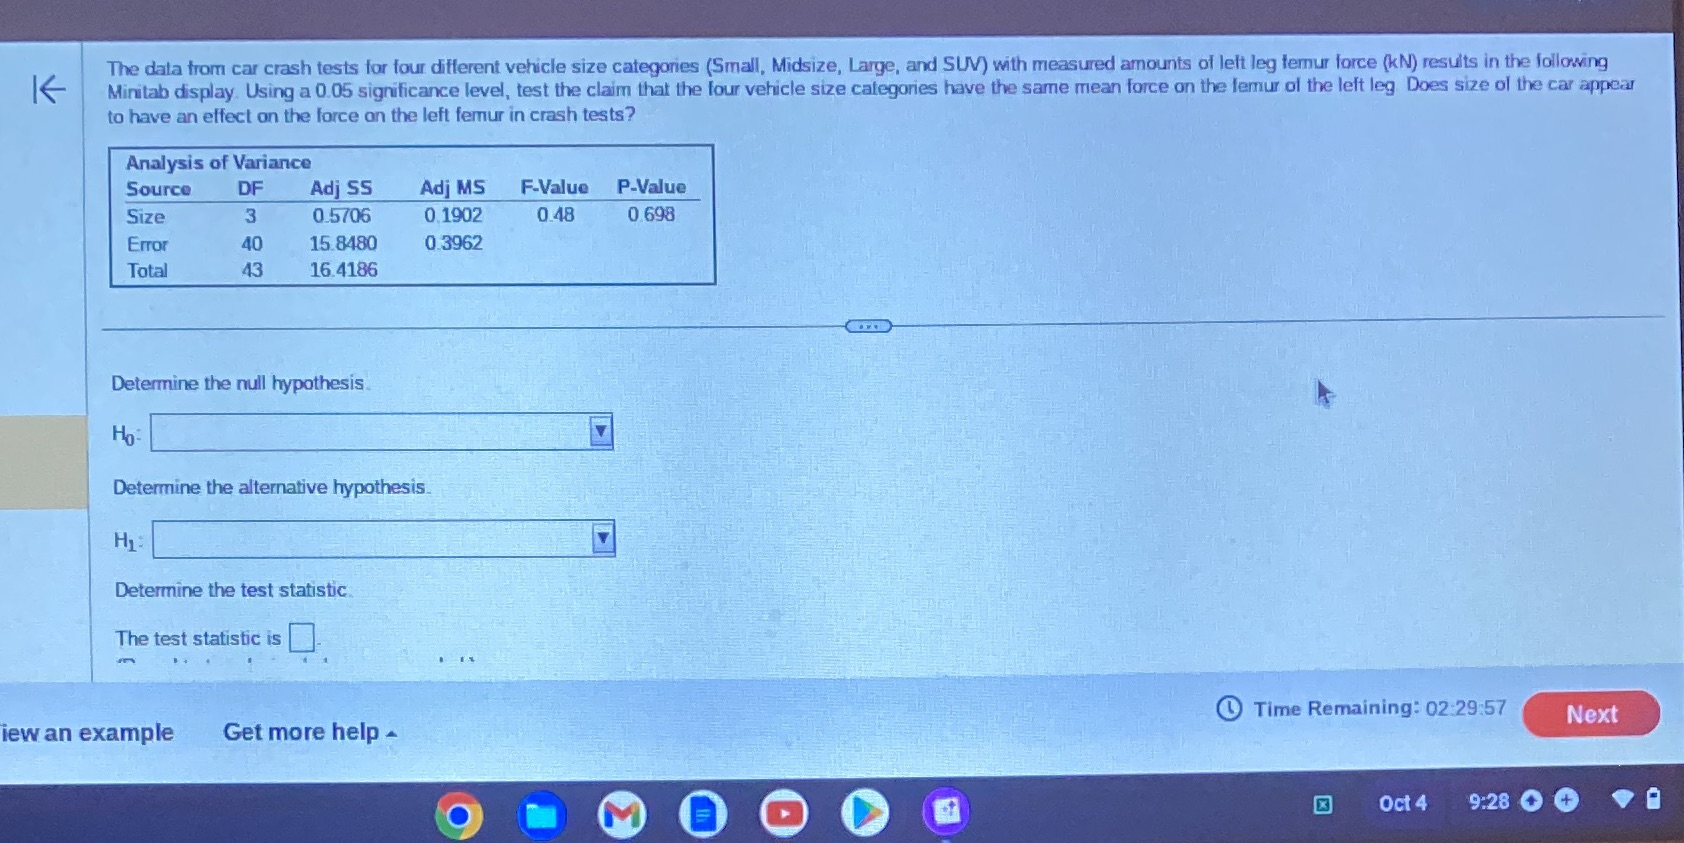
The data from car crash tests for four different vehicle size categories (Small, Midsize, Large, and SUV) with measured amounts of left leg femur force (kN) results in the following K Minitab display. Using a 0.05 significance level, test the claim that the four vehicle size categories have the same mean force on the femur of the left leg Does size of the car appear to have an effect on the force on the left femur in crash tests? Analysis of Variance Source DF Adj SS Adj MS F-Value P-Value Size 3 0.5706 0.1902 0.48 0.698 Error 40 15.8480 0.3962 Total 43 16.4186 Determine the null hypothesis Ho Determine the alternative hypothesis H1: Determine the test statistic. The test statistic is Time Remaining: 02:29:57 lew an example Get more help - Next M GOD X Oct 4 9:28 +
Step by Step Solution
There are 3 Steps involved in it

Get step-by-step solutions from verified subject matter experts