

Question: The data gathered {optimistic (a); most probable (m) and pessimistic (b) times) for a project you are managing are listed in the table below:
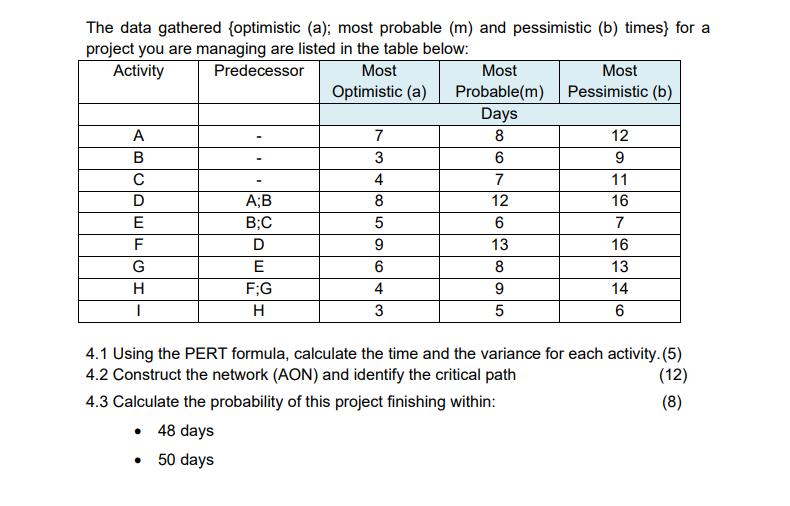
The data gathered {optimistic (a); most probable (m) and pessimistic (b) times) for a project you are managing are listed in the table below: Activity Predecessor Most Optimistic (a) A B C D E F G H I A;B B;C D E F;G H 7 3 4 8 5 9 6 4 3 Most Probable(m) Days 8 6 7 12 6 13 8 9 5 Most Pessimistic (b) 12 9 11 16 7 16 13 14 6 4.1 Using the PERT formula, calculate the time and the variance for each activity. (5) 4.2 Construct the network (AON) and identify the critical path (12) 4.3 Calculate the probability of this project finishing within: (8) 48 days 50 days
Step by Step Solution
There are 3 Steps involved in it
Answer A 85 ... View full answer

Get step-by-step solutions from verified subject matter experts