

Question: The data given in the first table are tip percentages (%) for 60 meals purchased during a typical day at a small restaurant. Each tip
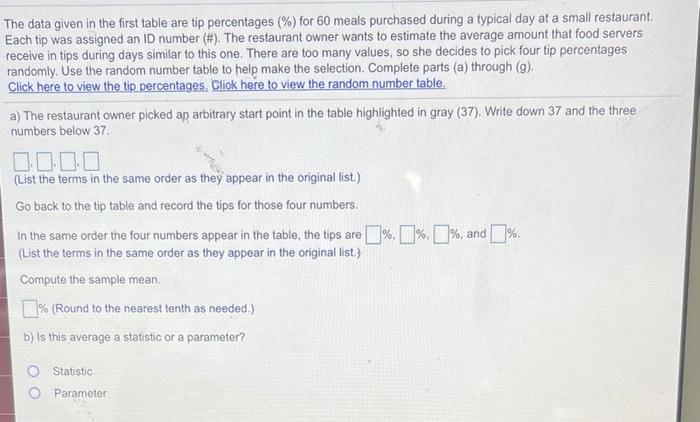
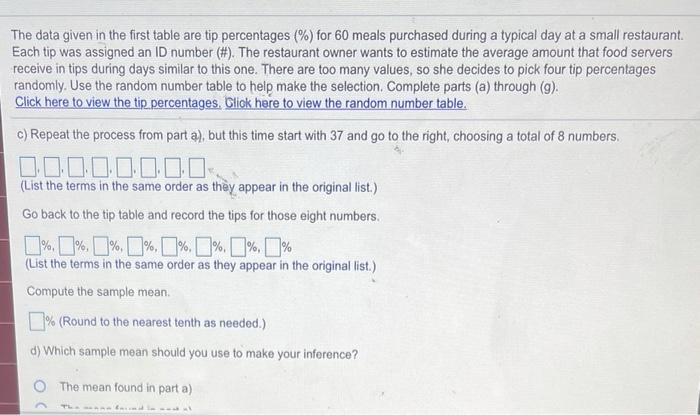
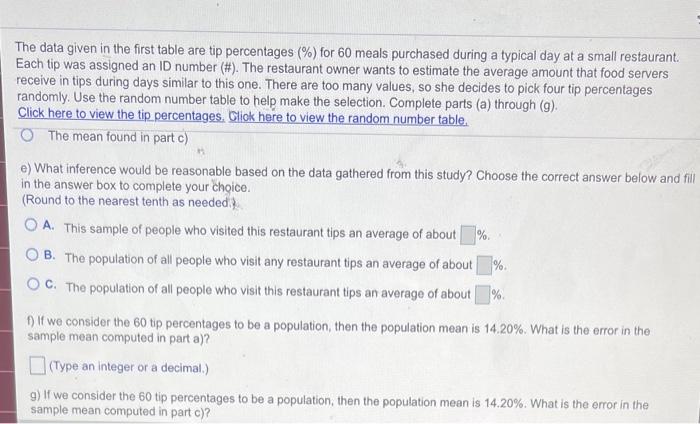
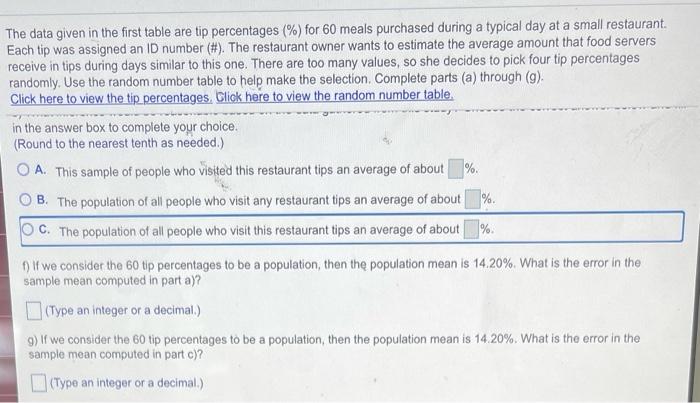
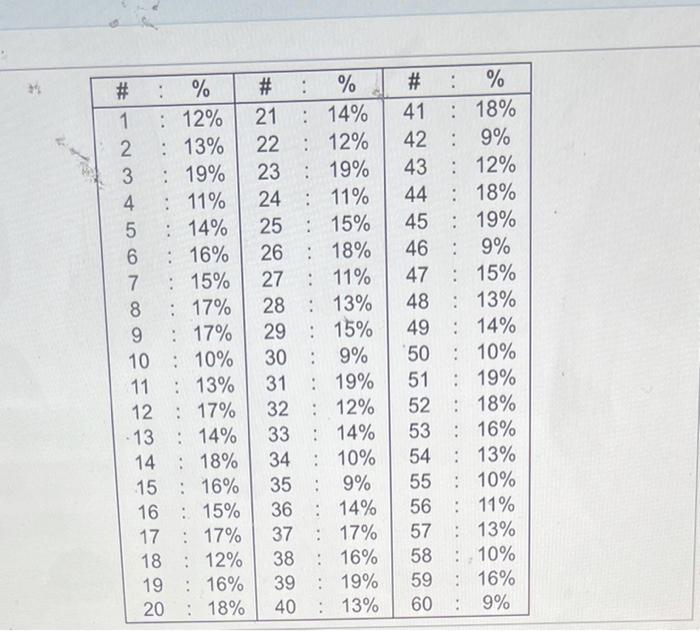
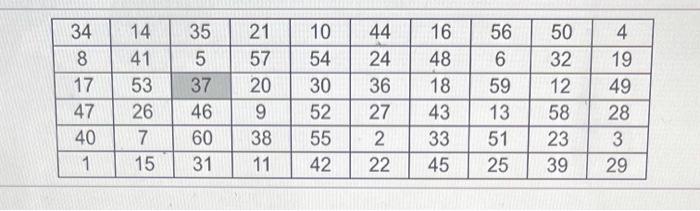
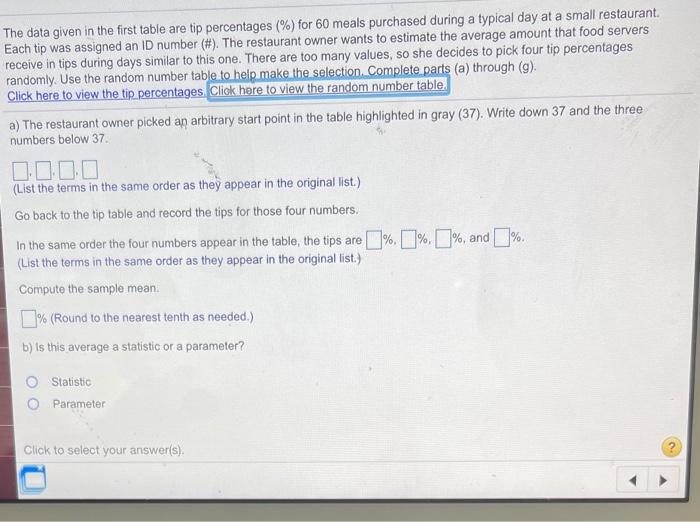
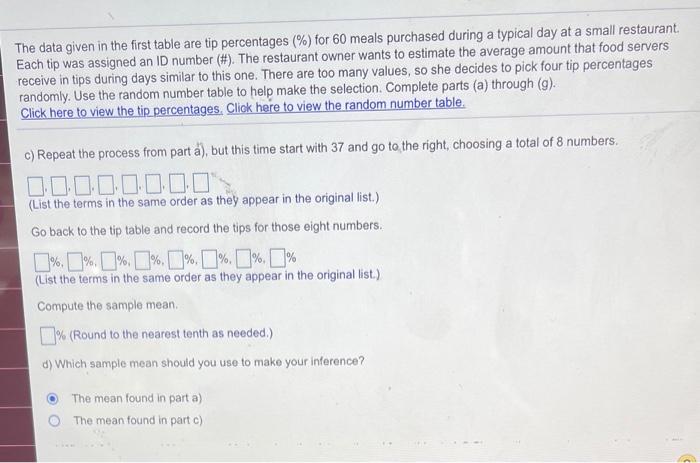
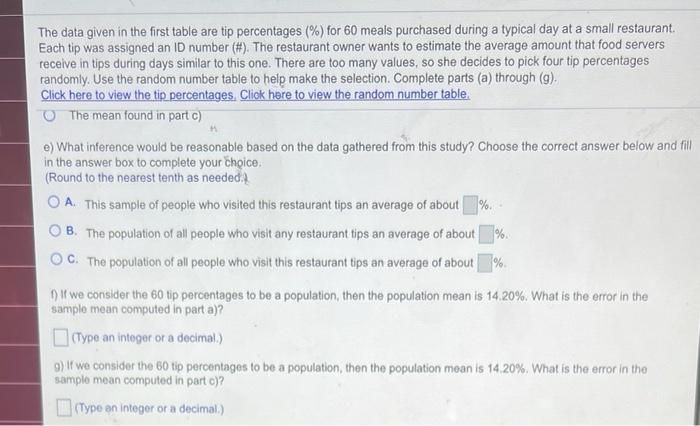
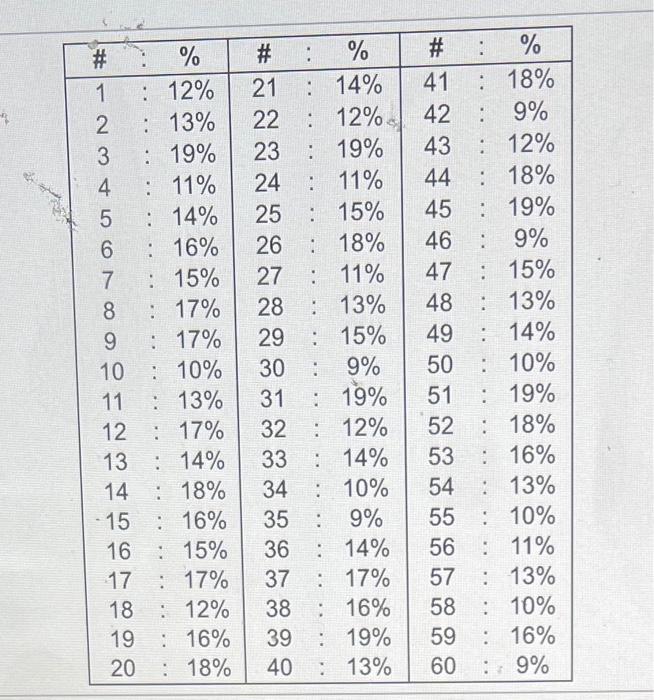
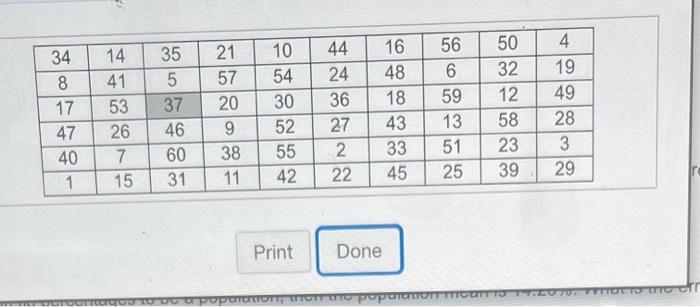
The data given in the first table are tip percentages (%) for 60 meals purchased during a typical day at a small restaurant. Each tip was assigned an ID number (#). The restaurant owner wants to estimate the average amount that food servers receive in tips during days similar to this one. There are too many values, so she decides to pick four tip percentages randomly. Use the random number table to help make the selection Complete parts (a) through (9) Click here to view the tip percentages. Click here to view the random number table. a) The restaurant owner picked an arbitrary start point in the table highlighted in gray (37). Write down 37 and the three numbers below 37 0.000 (List the terms in the same order as they appear in the original list.) Go back to the tip table and record the tips for those four numbers. In the same order the four numbers appear in the table, the tips are 1%, % 1%, and %. (List the terms in the same order as they appear in the original list.) Compute the sample mean. 1% (Round to the nearest tenth as needed.) b) Is this average a statistic or a parameter? Statistic Parameter The data given in the first table are tip percentages (%) for 60 meals purchased during a typical day at a small restaurant. Each tip was assigned an ID number (#). The restaurant owner wants to estimate the average amount that food servers receive in tips during days similar to this one. There are too many values, so she decides to pick four tip percentages randomly. Use the random number table to help make the selection. Complete parts (a) through (9). Click here to view the tip percentages. Click here to view the random number table. C) Repeat the process from part a), but this time start with 37 and go to the right choosing a total of 8 numbers. 00000000 (List the terms in the same order as they appear in the original list) Go back to the tip table and record the tips for those eight numbers. 1% 1% 1% 1% 1% 1% 1% 1% (List the terms in the same order as they appear in the original list.) Compute the sample mean. 1% (Round to the nearest tenth as needed.) d) Which sample mean should you use to make your inference? The mean found in parta) The data given in the first table are tip percentages (%) for 60 meals purchased during a typical day at a small restaurant Each tip was assigned an ID number (#). The restaurant owner wants to estimate the average amount that food servers receive in tips during days similar to this one. There are too many values, so she decides to pick four tip percentages randomly. Use the random number table to help make the selection. Complete parts (a) through (g). Click here to view the tip percentages. Click here to view the random number table. The mean found in partc) e) What inference would be reasonable based on the data gathered from this study? Choose the correct answer below and fill in the answer box to complete your choice. (Round to the nearest tenth as needed O A. This sample of people who visited this restaurant tips an average of about % B. The population of all people who visit any restaurant tips an average of about OC. The population of all people who visit this restaurant tips an average of about % 7) If we consider the 60 tip percentages to be a population, then the population mean is 14.20%. What is the error in the sample mean computed in part a)? (Type an integer or a decimal.) 9) If we consider the 60 tip percentages to be a population, then the population mean is 14.20%. What is the error in the sample mean computed in partc)? The data given in the first table are tip percentages (%) for 60 meals purchased during a typical day at a small restaurant Each tip was assigned an ID number (#). The restaurant owner wants to estimate the average amount that food servers receive in tips during days similar to this one. There are too many values, so she decides to pick four tip percentages randomly. Use the random number table to help make the selection Complete parts (a) through (9) Click here to view the tip percentages. Click here to view the random number table. in the answer box to complete your choice. (Round to the nearest tenth as needed.) O A. This sample of people who visited this restaurant tips an average of about % OB. The population of all people who visit any restaurant tips an average of about %. OC. The population of all people who visit this restaurant tips an average of about % f) If we consider the 60 tip percentages to be a population, then the population mean is 14.20% What is the error in the sample mean computed in part a)? (Type an integer or a decimal.) 9) If we consider the 60 tip percentages to be a population, then the population mean is 14.20%. What is the error in the sample mean computed in parte)? Type an integer or a decimal.) # : % 1 : 12% 2 : 13% 3 : 19% 4 : 11% 5 : 14% 6 : 16% 7 : 15% 8 : 17% 9 : 17% 10 : 10% 11 : 13% 12 : 17% - 13 : 14% 14 : 18% 15 16% : 15% 17 : 17% : 12% 19 : 16% 20 18% # : % 21 : 14% 22 : 12% 23 : 19% 24 : 11% 25 : 15% 26 : 18% 27 : 11% 28 : 13% 29 : 15% 30 : 9% 31 : 19% 32 : 12% 33 : 14% 34 : 10% 35 9% 36 : 14% 37 : 17% 38 : 16% 39 : 19% 40 : 13% # : % 41 : 18% 42 : 9% 43 : 12% 44 : 18% 45 : 19% 46 : 9% 47 : 15% 48 : 13% 49 : 14% 50 : 10% 51 : 19% 52 : 18% 53 : 16% 54 13% 55 : 10% 56 : 11% 57 : 13% 58 : 10% 59 : 16% 60 9% 16 18 34 8 17 47 40 1 14 41 53 26 7 15 35 5 37 46 60 31 21 57 20 9 38 11 10 54 30 52 55 42 44 24 36 27 2 22 16 48 18 43 33 45 56 6 59 13 51 25 50 32 12 58 23 39 4 19 49 28 3 29 The data given in the first table are tip percentages (%) for 60 meals purchased during a typical day at a small restaurant. Each tip was assigned an ID number (#). The restaurant owner wants to estimate the average amount that food servers receive in tips during days similar to this one. There are too many values, so she decides to pick four tip percentages randomly. Use the random number table to help make the selection Complete parts (a) through (9) Click here to view the tip percentages. Click here to view the random number table, a) The restaurant owner picked an arbitrary start point in the table highlighted in gray (37). Write down 37 and the three numbers below 37. 0.000 (List the terms in the same order as they appear in the original list.) Go back to the tip table and record the tips for those four numbers. In the same order the four numbers appear in the table, the tips are [%. [%, %, and %. (List the terms in the same order as they appear in the original list. Compute the sample mean % (Round to the nearest tenth as needed.) b) Is this average a statistic or a parameter? Statistic Parameter Click to select your answer(s). The data given in the first table are tip percentages (%) for 60 meals purchased during a typical day at a small restaurant Each tip was assigned an ID number (#). The restaurant owner wants to estimate the average amount that food servers receive in tips during days similar to this one. There are too many values, so she decides to pick four tip percentages randomly. Use the random number table to help make the selection. Complete parts (a) through (9). Click here to view the tin percentages. Click here to view the random number table. C) Repeat the process from part ), but this time start with 37 and go to the right, choosing a total of 8 numbers. 00000000" (List the terms in the same order as they appear in the original list.) Go back to the tip table and record the tips for those eight numbers. (List the terms in the same order as they appear in the original list.) Compute the sample mean 1% (Round to the nearest tenth as needed) d) Which sample mean should you use to make your inference? The mean found in part a) The mean found in part) The data given in the first table are tip percentages (%) for 60 meals purchased during a typical day at a small restaurant Each tip was assigned an ID number (#). The restaurant owner wants to estimate the average amount that food servers receive in tips during days similar to this one. There are too many values, so she decides to pick four tip percentages randomly. Use the random number table to help make the selection. Complete parts (a) through (9) Click here to view the tip percentages. Click here to view the random number table The mean found in partc) e) What inference would be reasonable based on the data gathered from this study? Choose the correct answer below and fill in the answer box to complete your choice. (Round to the nearest tenth as needed O A. This sample of people who visited this restaurant tips an average of about %. OB. The population of all people who visit any restaurant tips an average of about % OC. The population of all people who visit this restaurant tips an average of about 1% If we consider the 60 tip percentages to be a population, then the population mean is 14.20%. What is the error in the sample mean computed in part a)? (Type an intoger or a decimal.) 9) If we consider the 60 tip percentages to be a population, then the population mean is 14.20%. What is the error in the sample mean computed in partc)? (Type an Integer or a decimal.) 1 % N 56789 # 1 : 12% : 13% 3 : 19% 4. : 11% : 14% : 16% : 15% : 17% : 17% 10 : 10% 11 : 13% 12 : 17% 13 : 14% 14 : 18% - 15 : 16% : 15% 17 : 17% 18 : 12% 19 : 16% 20 : 18% # 21 22 23 24 25 26 27 28 29 30 31 32 33 34 35 36 37 38 39 40 : % : 14% : 12% : 19% . 11% : 15% 18% : 11% : 13% : 15% : 9% : 19% : 12% : 14% : 10% 9% : 14% : 17% : 16% : 19% : 13% # : % 41 : 18% 42 : 9% 43 : 12% 44 : 18% 45 : 19% 46 : 9% 47 : 15% 48 : 13% 49 : 14% 50 : 10% 51 : 19% 52 : 18% 53 : 16% 54 : 13% 55 : 10% 56 : 11% 57 : 13% 58 : 10% 59 : 16% 60 : 9% 16 34 8 35 5 56 6 37 17 59 14 41 53 26 7 15 10 54 30 52 55 21 57 20 9 38 11 44 24 36 27 2 22 16 48 18 43 33 45 50 32 12 58 23 39 4 19 49 28 3 29 47 40 1 46 60 31 13 51 25 42 Print Done 70: VITTORE TO Tour
Step by Step Solution
There are 3 Steps involved in it

Get step-by-step solutions from verified subject matter experts