

Question: The data given in the following table represent experimental, frequency response data for a process consisting of a first-order process and a transportation lag. Determine
The data given in the following table represent experimental, frequency response data for a process consisting of a first-order process and a transportation lag. Determine the time constant and the transportation lag parameter. Write the transfer function for the process, giving numerical values of the parameters. 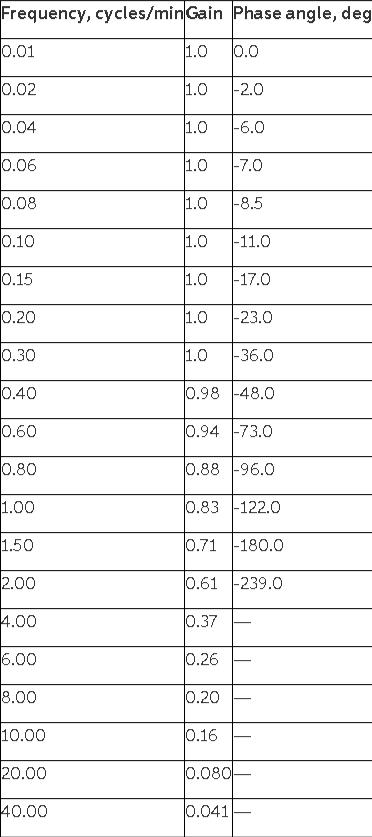
Frequency, cycles/minGain Phase angle, deg 0.01 1.0 0.0 0.02 1.0 |-2.0 0.04 1.0 |-6.0 0.06 1.0 |-7.0 0.08 1.0 |-8.5 0.10 1.0 |-11.0 0.15 1.0 |-17.0 0.20 1.0 |-23.0 0.30 1.0 |-36.0 0.40 0.98 -48.0 0.60 0.94 -73.0 0.80 0.88 -96.0 1.00 0.83 -122.0 1.50 0.71 -180.0 2.00 0.61 -239.0 4.00 0.37 6.00 0.26 8.00 0.20 10.00 0.16 20.00 0.080 40.00 0.041
Step by Step Solution
3.44 Rating (160 Votes )
There are 3 Steps involved in it
To determine the time constant and the transportation lag parameter from the frequency response data ... View full answer

Get step-by-step solutions from verified subject matter experts