

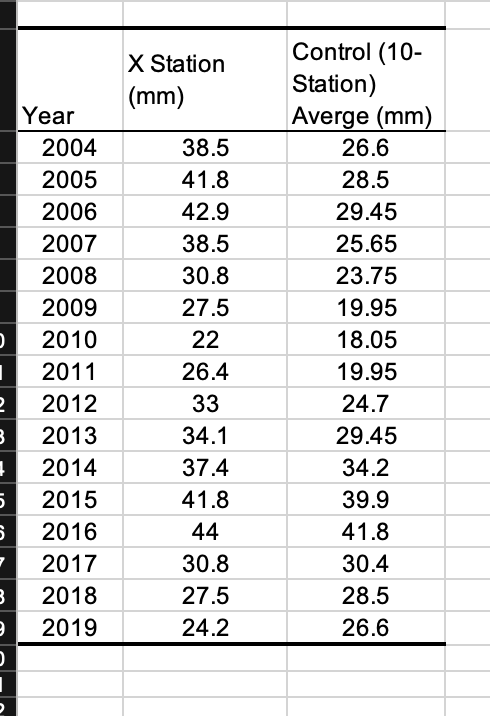
Question: The data given table ( Homework folder in Black Board ) are measured average annual rainfall data for a gage station located in Edwardsville, IL
The data given table Homework folder in Black Board are measured average annual rainfall
data for a gage station located in Edwardsville, IL and other gage stations around the City of
Edwardsville. This gage station was temporary located in another City Alton IL from to
and relocated in Edwardsville, IL again since Use doublemass curve to correct
adjust the inconsistence data at the Edwardsville, IL gage station from to
a Plot the slope of cumulative data using the measured values in the gage of interest and
reference gage stations total b What is a combined slope of curve after adjusting the data?
Please, use Excel to solve this question, but do not have to turn in the excel sheet but the
plotted curve and slope value only.
Step by Step Solution
There are 3 Steps involved in it
1 Expert Approved Answer
Step: 1 Unlock

Question Has Been Solved by an Expert!
Get step-by-step solutions from verified subject matter experts
Step: 2 Unlock
Step: 3 Unlock