

Question: The data given to the right includes data from 38 candies, Weights (g) of a Sample Bag of Candy and 6 of them are red.
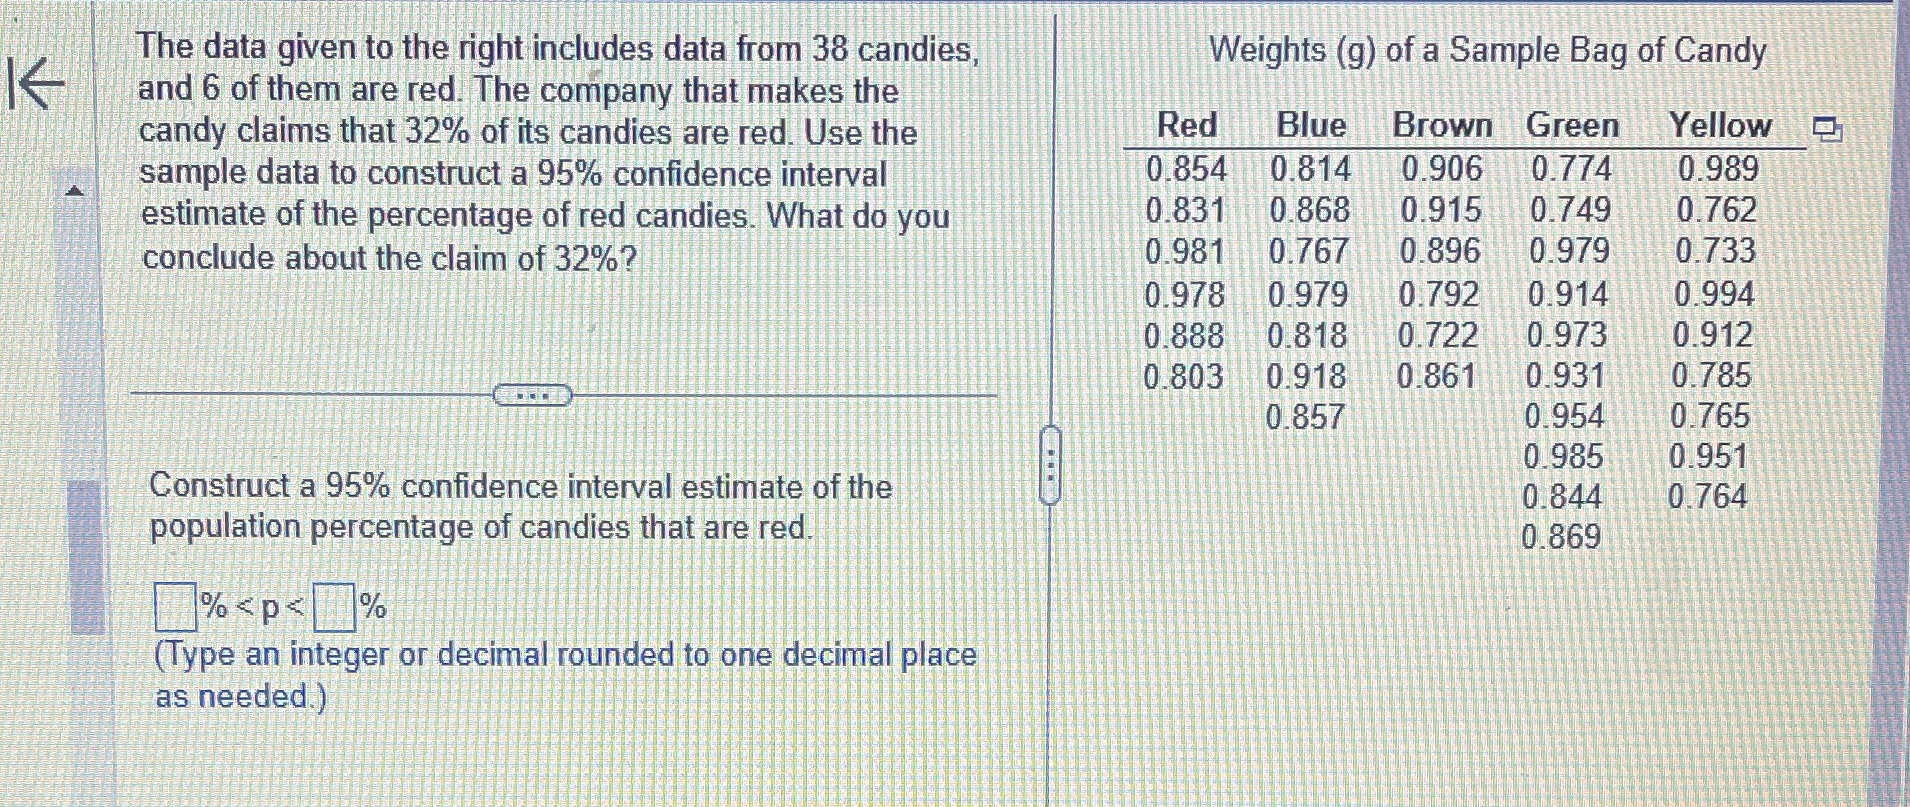
The data given to the right includes data from 38 candies, Weights (g) of a Sample Bag of Candy and 6 of them are red. The company that makes the candy claims that 32% of its candies are red. Use the Red Blue Brown Green Yellow sample data to construct a 95% confidence interval 0.854 0.814 0.906 0.774 0.989 estimate of the percentage of red candies. What do you 0.831 0.868 0.915 0.749 0.762 conclude about the claim of 32%? 0.981 0.767 0.896 0.979 0.733 0.978 0.979 0.792 0.914 0.994 0.888 0.818 0.722 0.973 0.912 0.803 0.918 0.861 0.931 0.785 0.857 0.954 0.765 0.985 0.951 Construct a 95% confidence interval estimate of the 0.844 0.764 population percentage of candies that are red. 0.869 %
Step by Step Solution
There are 3 Steps involved in it

Get step-by-step solutions from verified subject matter experts