

Question: The data in Table 3.15 show the total output (a mixture of consumer, capital, and government services) and the prices of each product for
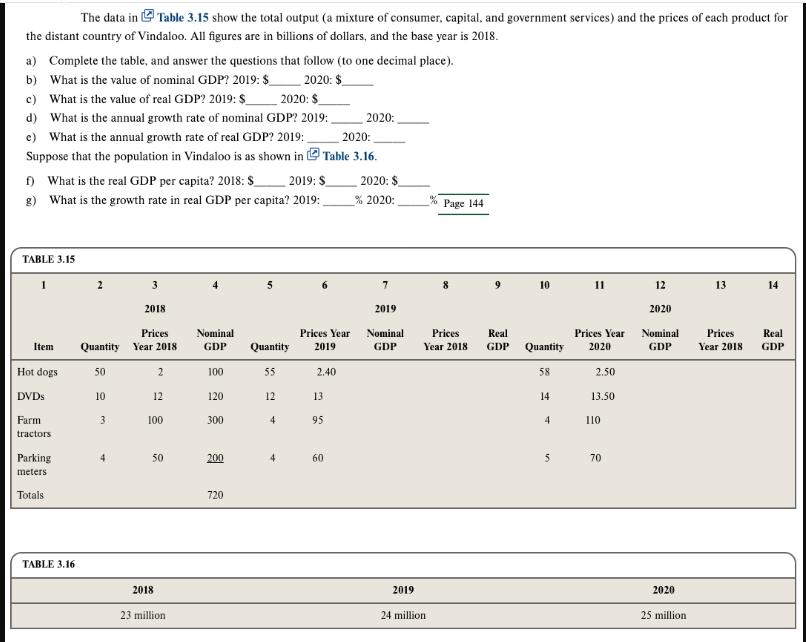
The data in Table 3.15 show the total output (a mixture of consumer, capital, and government services) and the prices of each product for the distant country of Vindaloo. All figures are in billions of dollars, and the base year is 2018. a) Complete the table, and answer the questions that follow (to one decimal place). b) What is the value of nominal GDP? 2019: $ 2020: $ 2020: $ c) What is the value of real GDP? 2019: $ d) What is the annual growth rate of nominal GDP? 2019: e) What is the annual growth rate of real GDP? 2019: Suppose that the population in Vindaloo is as shown in 2019: $ f) What is the real GDP per capita? 2018: S g) What is the growth rate in real GDP per capita? 2019: TABLE 3.15 Item Hot dogs DVDs Farm tractors Parking meters Totals TABLE 3.16 2 Quantity 50 10 3 4 3 2018 Prices Year 2018 2 12 100 50 2018 23 million Nominal GDP 100 120 300 200 720 Prices Year Quantity 2019 55 12 2020: Table 3.16. 4 2.40 13 95 2020: 60 2020: $ % 2020: 7 2019 Nominal GDP 2019 Page 144 24 million 8 Prices Year 2018 9 Real GDP 10 Quantity 58 14 4 5 11 2.50 Prices Year Nominal 2020 GDP 13.50 110 12 70 2020 2020 25 million 13 Prices Year 2018 14 Real GDP
Step by Step Solution
There are 3 Steps involved in it
Based on the information in the table it is possible to answer the following ques... View full answer

Get step-by-step solutions from verified subject matter experts