

Question: Use the data below to estimate a multiplicative demand function for Mrs. Smyths frozen fruit pies. Report your parameter estimates and regression statistics for the
Use the data below to estimate a multiplicative demand function for Mrs. Smyth’s frozen fruit pies. Report your parameter estimates and regression statistics for the multiplicative model.
Qit = b0 + b1Pit + b2Ait + b3PXit + b4Yit + b5Popit + b6Tit + uit
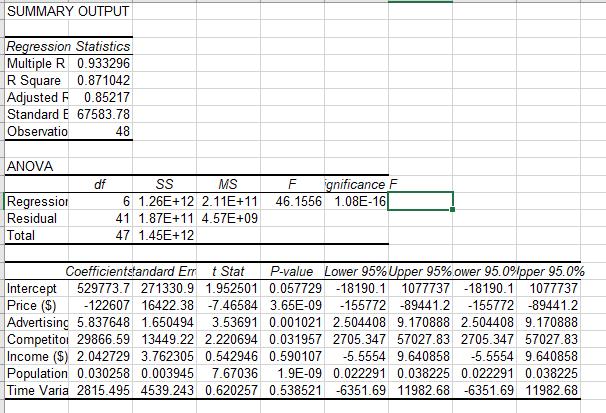
a) Describe the statistical significance of each of the independent variables included in the Mrs. Smyth’s demand equation. Interpret the coefficient of determination and F statistic for the multiplicative model.
b) Compare the statistical properties of your multiplicative model with the linear model. Which fits the data better? Explain why.
c) In the multiplicative model perform a statistical test to determine whether demand is elastic, your competitor’s product is a substitute, and if pies are a normal good at the 95 percent confidence level.
d) What is your estimate of the price elasticity of demand, advertising elasticity of demand, income elasticity of demand, and cross price elasticity of demand in the multiplicative model? Compare these elasticity estimates with the corresponding elasticities in the linear model when calculated at mean values for each variable.
e) Using the linear model, what is the expected value of next quarter’s unit sales in the Minneapolis-St. Paul, MN market? Use the value of each independent variable for the last period in the MN market for this forecast. Derive the 95 percent confidence interval for next quarter’s actual sales in the Minneapolis- St. Paul market.
SUMMARY OUTPUT Regression Statistics Multiple R 0.933296 R Square 0.871042 Adjusted F 0.85217 Standard E 67583.78 Observatio 48 ANOVA Regression Residual Total df SS MS 6 1.26E+12 2.11E+11 41 1.87E+11 4.57E+09 47 1.45E+12 F ignificance F 46.1556 1.08E-16 Coefficientstandard Err t Stat P-value Lower 95% Upper 95%.ower 95.0%pper 95.0% 529773.7 271330.9 1.952501 0.057729 -18190.1 1077737 -18190.1 1077737 -122607 16422.38 -7.46584 3.65E-09 -155772 -89441.2 -155772 -89441.2 1.650494 3.53691 0.001021 2.504408 9.170888 2.504408 9.170888 13449.22 2.220694 0.031957 2705.347 57027.83 2705.347 57027.83 -5.5554 9.640858 -5.5554 9.640858 1.9E-09 0.022291 0.038225 0.022291 0.038225 3.762305 0.542946 0.590107 Intercept Price (S) Advertising 5.837648 Competitor 29866.59 Income ($) 2.042729 Population 0.030258 0.003945 7.67036 Time Varia 2815.495 4539.243 0.620257 0.538521 -6351.69 11982.68 -6351.69 11982.68
Step by Step Solution
3.43 Rating (156 Votes )
There are 3 Steps involved in it
Here is a table summarizing the statistical significance of each independent variable and the regression statistics for the multiplicative model Independent Variable Coefficient Standard Error tStatis... View full answer

Get step-by-step solutions from verified subject matter experts