

Question: The data in the below graph were collected using one of the single-subject experimental designs. Which one? Frequency of Behavior 80- -O- Baseline Treatment
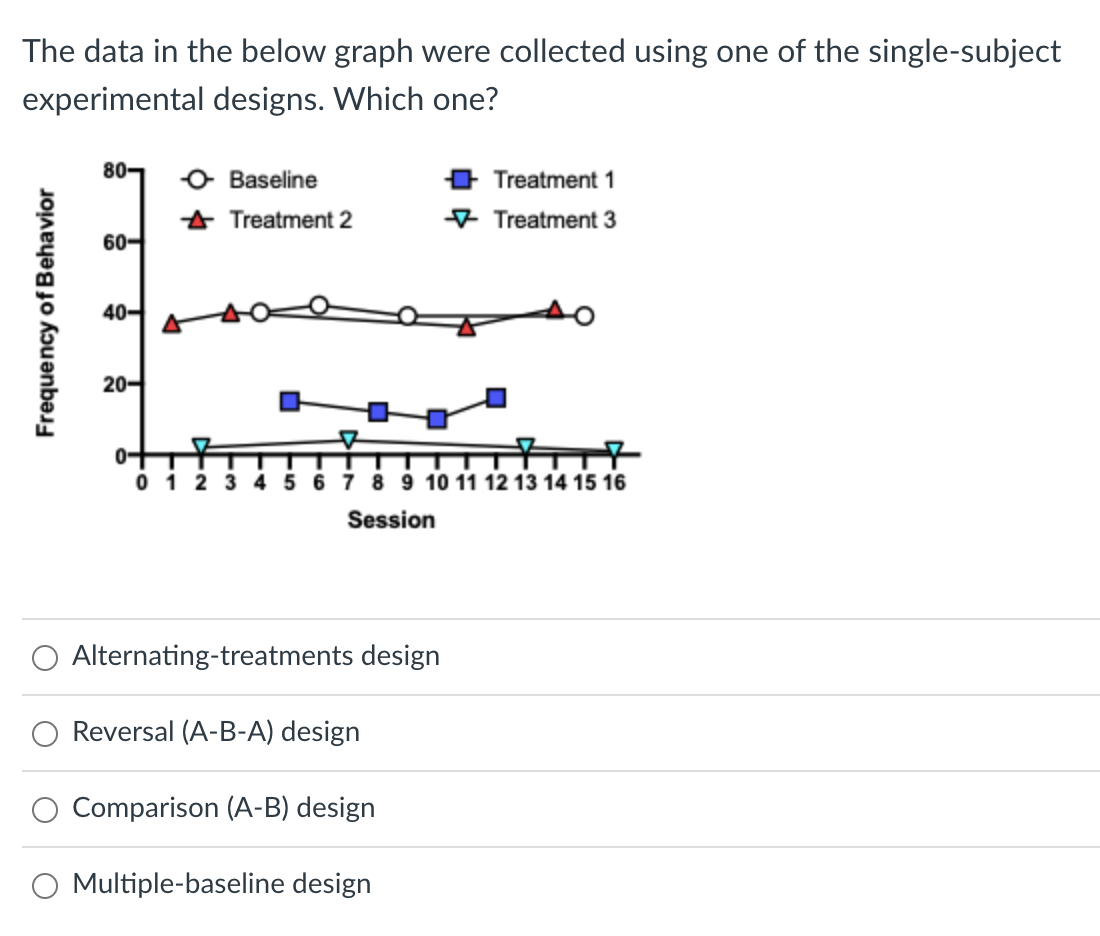
The data in the below graph were collected using one of the single-subject experimental designs. Which one? Frequency of Behavior 80- -O- Baseline Treatment 1 Treatment 2 Treatment 3 60- 40- 20- 0- 7117 0123 5 6 7 8 9 10 11 12 13 14 15 16 Session Alternating-treatments design Reversal (A-B-A) design Comparison (A-B) design Multiple-baseline design
Step by Step Solution
There are 3 Steps involved in it
1 Expert Approved Answer
Step: 1 Unlock

Question Has Been Solved by an Expert!
Get step-by-step solutions from verified subject matter experts
Step: 2 Unlock
Step: 3 Unlock