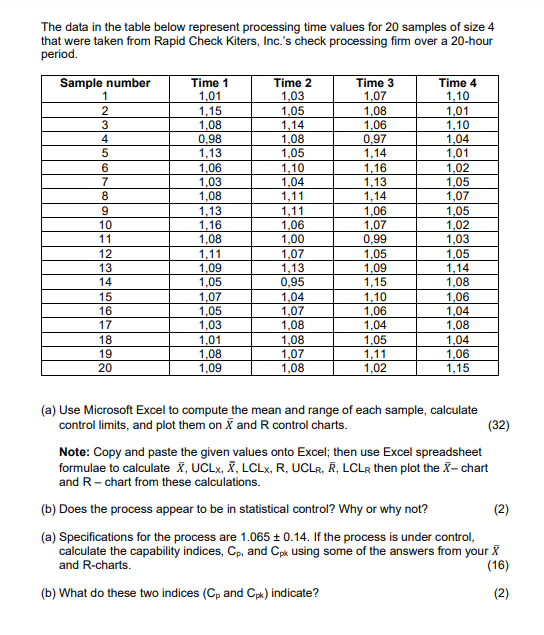
Question: The data in the table below represent processing time values for 20 samples of size 4 that were taken from Rapid Check Kiters, Inc.'s check

The data in the table below represent processing

The data in the table below represent processing time values for 20 samples of size 4 that were taken from Rapid Check Kiters, Inc.'s check processing firm over a 20-hour period. Sample number 1 2 3 4 5 6 7 8 9 10 11 12 13 14 15 16 17 18 19 20 Time 1 1.01 1,15 1.08 0,98 1,13 1.06 1,03 1,08 1,13 1,16 1,08 1.11 1,09 1,05 1,07 1,05 1,03 1.01 1,08 1,09 Time 2 1,03 1,05 1,14 1,08 1,05 1,10 1,04 1,11 1,11 1,06 1,00 1.07 1,13 0,95 1,04 1,07 1,08 1,08 1,07 1,08 Time 3 1.07 1,08 1,06 0.97 1.14 1.16 1,13 1,14 1,06 1,07 0,99 1.05 1,09 1,15 1,10 1,06 1,04 1,05 1.11 1,02 Time 4 1,10 1,01 1,10 1,04 1,01 1,02 1,05 1,07 1,05 1,02 1.03 1,05 1,14 1,08 1,06 1,04 1,08 1,04 1,06 1,15 (a) Use Microsoft Excel to compute the mean and range of each sample, calculate control limits, and plot them on X and R control charts. (32) Note: Copy and paste the given values onto Excel; then use Excel spreadsheet formulae to calculate X, UCLX, X, LCLX, R, UCLR, R, LCLR then plot the X-chart and R-chart from these calculations. (b) Does the process appear to be in statistical control? Why or why not? (2) (a) Specifications for the process are 1.065 +0.14. If the process is under control, calculate the capability indices, Cp, and Cpk using some of the answers from your X and R-charts. (16) (b) What do these two indices (Cp and Cpk) indicate? (2)

Step by Step Solution

There are 3 Steps involved in it

1 Expert Approved Answer
Step: 1 Unlock blur-text-image
Question Has Been Solved by an Expert!

Get step-by-step solutions from verified subject matter experts

Step: 2 Unlock
Step: 3 Unlock

Students Have Also Explored These Related General Management Questions!