Question: The initial data provided in the Excel workbook C08 Problem Data represent processing time values for 20 samples of size 4 that were taken from
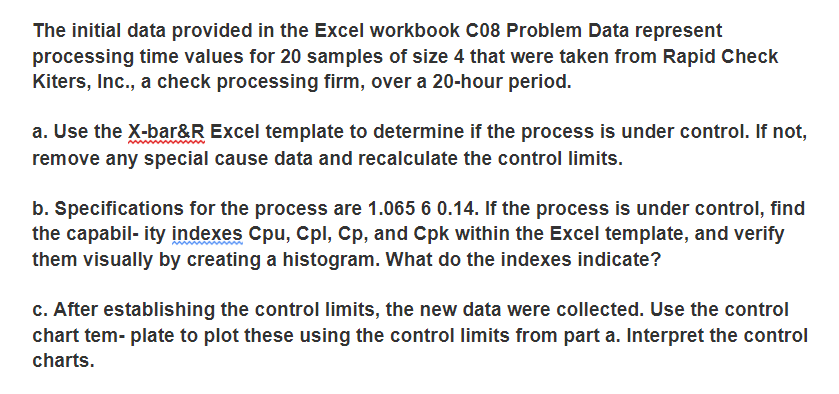
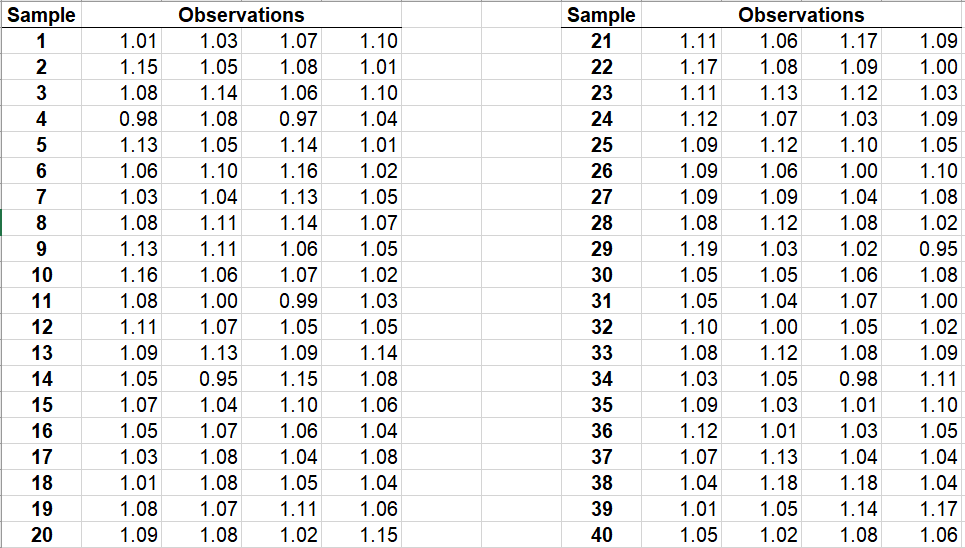
The initial data provided in the Excel workbook C08 Problem Data represent processing time values for 20 samples of size 4 that were taken from Rapid Check Kiters, Inc., a check processing firm, over a 20-hour period. a. Use the X-bar&R Excel template to determine if the process is under control. If not, remove any special cause data and recalculate the control limits. b. Specifications for the process are 1.065 6 0.14. If the process is under control, find the capabil- ity indexes Cpu, Cpl, Cp, and Cpk within the Excel template, and verify them visually by creating a histogram. What do the indexes indicate? c. After establishing the control limits, the new data were collected. Use the control chart tem-plate to plot these using the control limits from part a. Interpret the control charts. 1.09 1.06 Sample 1 2 3 4 5 6 7 8 9 10 11 12 13 14 15 16 17 18 19 20 1.01 1.15 1.08 0.98 1.13 1.06 1.03 1.08 1.13 1.16 1.08 1.11 1.09 1.05 1.07 1.05 1.03 1.01 1.08 1.09 Observations 1.03 1.07 1.05 1.08 1.14 1.06 1.08 0.97 1.05 1.14 1.10 1.16 1.04 1.13 1.11 1.14 1.11 1.06 1.07 1.00 0.99 1.07 1.05 1.13 1.09 0.95 1.15 1.04 1.10 1.07 1.06 1.08 1.04 1.08 1.05 1.07 1.08 1.02 1.10 1.01 1.10 1.04 1.01 1.02 1.05 1.07 1.05 1.02 1.03 1.05 1.14 1.08 1.06 1.04 1.08 1.04 1.06 1.15 Sample 21 22 23 24 25 26 27 28 29 30 31 32 33 34 35 36 37 38 39 40 1.11 1.17 1.11 1.12 1.09 1.09 1.09 1.08 1.19 1.05 1.05 1.10 1.08 1.03 1.09 1.12 1.07 1.04 1.01 1.05 Observations 1.06 1.17 1.08 1.09 1.13 1.12 1.07 1.03 1.12 1.10 1.06 1.00 1.09 1.04 1.12 1.08 1.03 1.02 1.05 1.06 1.04 1.07 1.00 1.05 1.12 1.08 1.05 0.98 1.03 1.01 1.01 1.03 1.13 1.04 1.18 1.18 1.05 1.14 1.02 1.08 1.00 1.03 1.09 1.05 1.10 1.08 1.02 0.95 1.08 1.00 1.02 1.09 1.11 1.10 1.05 1.04 1.04 1.17 1.06 1.11 The initial data provided in the Excel workbook C08 Problem Data represent processing time values for 20 samples of size 4 that were taken from Rapid Check Kiters, Inc., a check processing firm, over a 20-hour period. a. Use the X-bar&R Excel template to determine if the process is under control. If not, remove any special cause data and recalculate the control limits. b. Specifications for the process are 1.065 6 0.14. If the process is under control, find the capabil- ity indexes Cpu, Cpl, Cp, and Cpk within the Excel template, and verify them visually by creating a histogram. What do the indexes indicate? c. After establishing the control limits, the new data were collected. Use the control chart tem-plate to plot these using the control limits from part a. Interpret the control charts. 1.09 1.06 Sample 1 2 3 4 5 6 7 8 9 10 11 12 13 14 15 16 17 18 19 20 1.01 1.15 1.08 0.98 1.13 1.06 1.03 1.08 1.13 1.16 1.08 1.11 1.09 1.05 1.07 1.05 1.03 1.01 1.08 1.09 Observations 1.03 1.07 1.05 1.08 1.14 1.06 1.08 0.97 1.05 1.14 1.10 1.16 1.04 1.13 1.11 1.14 1.11 1.06 1.07 1.00 0.99 1.07 1.05 1.13 1.09 0.95 1.15 1.04 1.10 1.07 1.06 1.08 1.04 1.08 1.05 1.07 1.08 1.02 1.10 1.01 1.10 1.04 1.01 1.02 1.05 1.07 1.05 1.02 1.03 1.05 1.14 1.08 1.06 1.04 1.08 1.04 1.06 1.15 Sample 21 22 23 24 25 26 27 28 29 30 31 32 33 34 35 36 37 38 39 40 1.11 1.17 1.11 1.12 1.09 1.09 1.09 1.08 1.19 1.05 1.05 1.10 1.08 1.03 1.09 1.12 1.07 1.04 1.01 1.05 Observations 1.06 1.17 1.08 1.09 1.13 1.12 1.07 1.03 1.12 1.10 1.06 1.00 1.09 1.04 1.12 1.08 1.03 1.02 1.05 1.06 1.04 1.07 1.00 1.05 1.12 1.08 1.05 0.98 1.03 1.01 1.01 1.03 1.13 1.04 1.18 1.18 1.05 1.14 1.02 1.08 1.00 1.03 1.09 1.05 1.10 1.08 1.02 0.95 1.08 1.00 1.02 1.09 1.11 1.10 1.05 1.04 1.04 1.17 1.06 1.11


