

Question: The data in the table is from the second problem of ICE 6. Now assume that the standard deviation of each activity is 30% of
The data in the table is from the second problem of ICE 6. Now assume that the standard deviation of each activity is 30% of the activity time; so for A, the standard deviation is 30%*5 = 1.5, for B, the standard deviation is 30%*10 = 3, etc.
Simulate this networks completion time at least 2500 times in Excel and then estimate the answers below.
1.) According to your simulation, what percentage of the time is each path through the network the critical path? (This might be trickier than it sounds.) Your answer will be five percentages that add up to 100%.
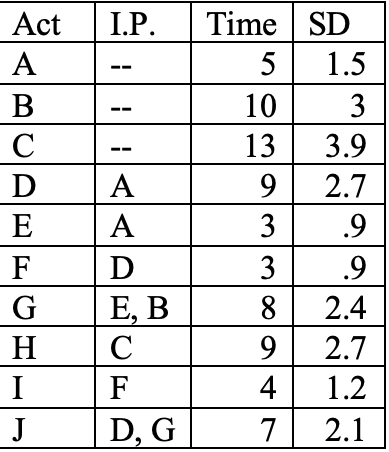
\begin{tabular}{|l|l|r|r|} \hline Act & I.P. & Time & SD \\ \hline A & -- & 5 & 1.5 \\ \hline B & -- & 10 & 3 \\ \hline C & -- & 13 & 3.9 \\ \hline D & A & 9 & 2.7 \\ \hline E & A & 3 & .9 \\ \hline F & D & 3 & .9 \\ \hline G & E,B & 8 & 2.4 \\ \hline H & C & 9 & 2.7 \\ \hline I & F & 4 & 1.2 \\ \hline J & D,G & 7 & 2.1 \\ \hline \end{tabular}
Step by Step Solution
There are 3 Steps involved in it

Get step-by-step solutions from verified subject matter experts