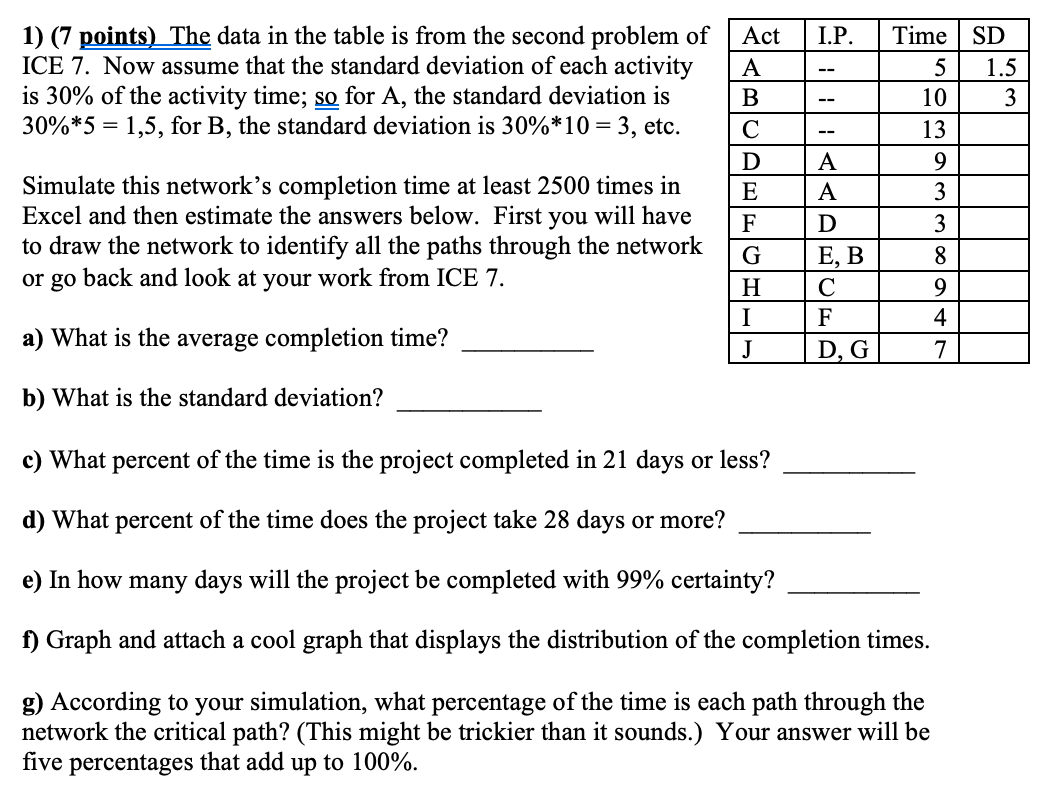
Question: I.P. 1) (7 points) The data in the table is from the second problem of ICE 7. Now assume that the standard deviation of each

I.P. 1) (7 points) The data in the table is from

I.P. 1) (7 points) The data in the table is from the second problem of ICE 7. Now assume that the standard deviation of each activity is 30% of the activity time; so for A, the standard deviation is 30%*5 = 1,5, for B, the standard deviation is 30%*10 = 3, etc. Act A B D E F G H I J Time SD 5 1.5 10 3 13 9 3 3 Simulate this network's completion time at least 2500 times in Excel and then estimate the answers below. First you will have to draw the network to identify all the paths through the network or go back and look at your work from ICE 7. A A D E, B F D G 8 9 4 a) What is the average completion time? 7 b) What is the standard deviation? c) What percent of the time is the project completed in 21 days or less? d) What percent of the time does the project take 28 days or more? e) In how many days will the project be completed with 99% certainty? f) Graph and attach a cool graph that displays the distribution of the completion times. g) According to your simulation, what percentage of the time is each path through the network the critical path? (This might be trickier than it sounds.) Your answer will be five percentages that add up to 100%

Step by Step Solution

There are 3 Steps involved in it

1 Expert Approved Answer
Step: 1 Unlock blur-text-image
Question Has Been Solved by an Expert!

Get step-by-step solutions from verified subject matter experts

Step: 2 Unlock
Step: 3 Unlock

Students Have Also Explored These Related General Management Questions!