

Question: The data in the table represent the tuition for all 2-year community colleges in a region in 2014-2015. (a) Complete the cumulative frequency distribution. (a)
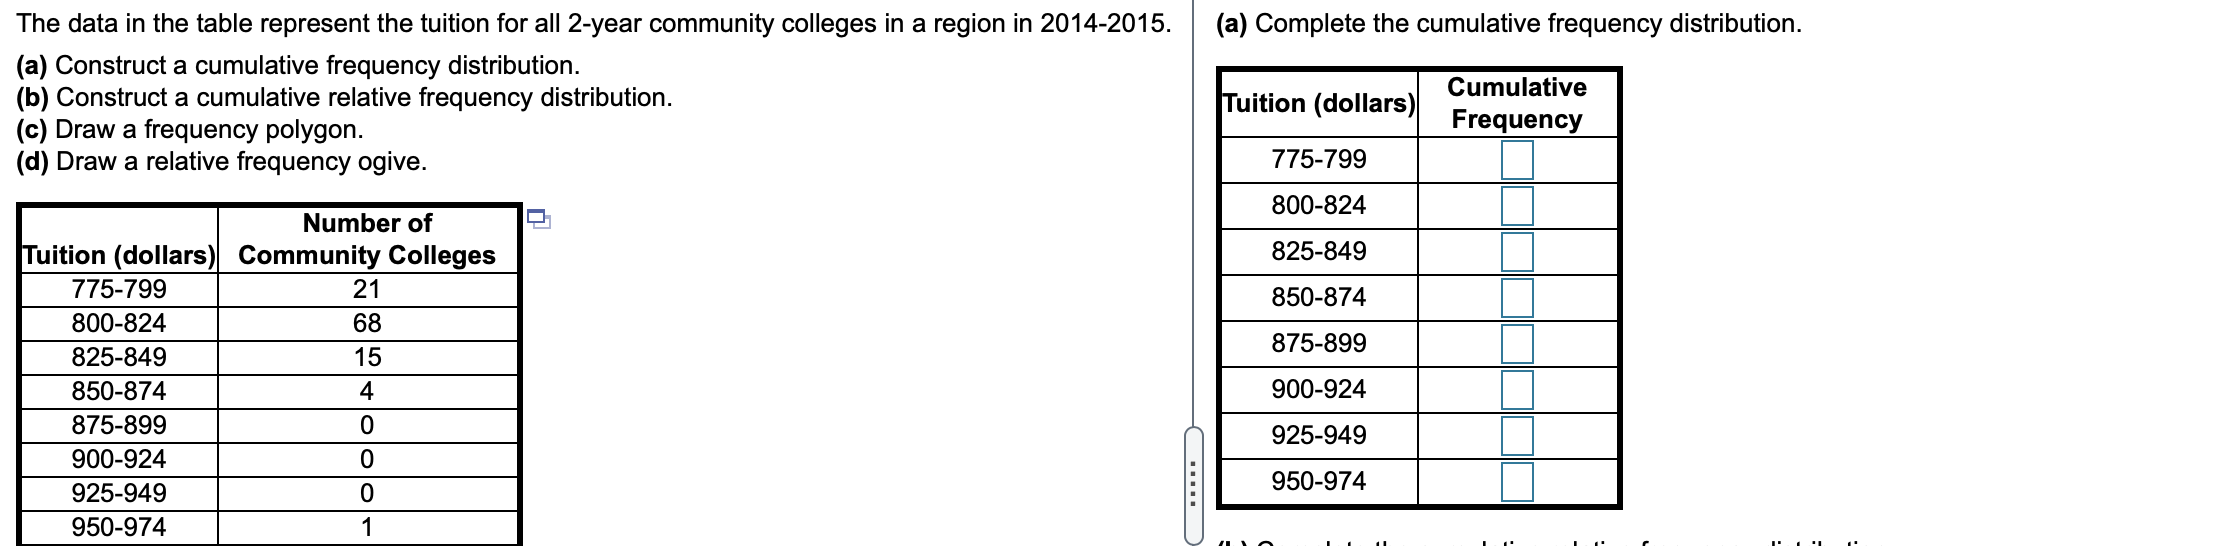
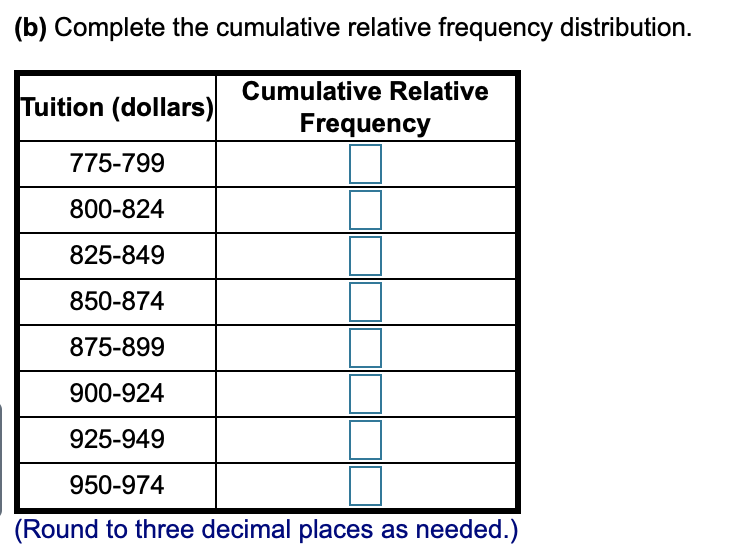
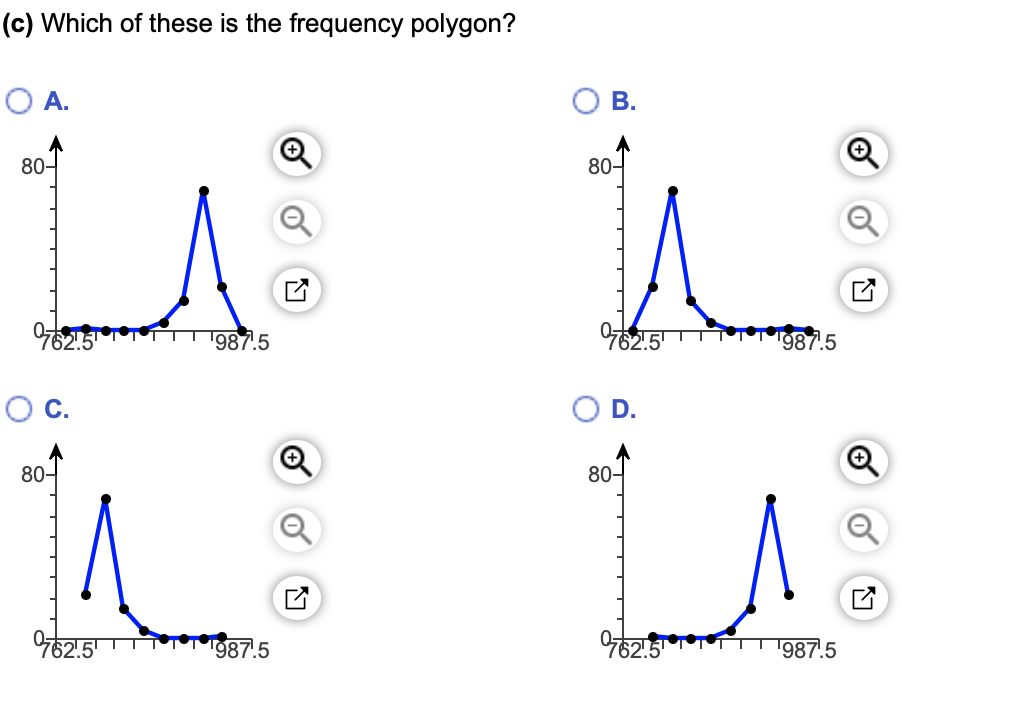
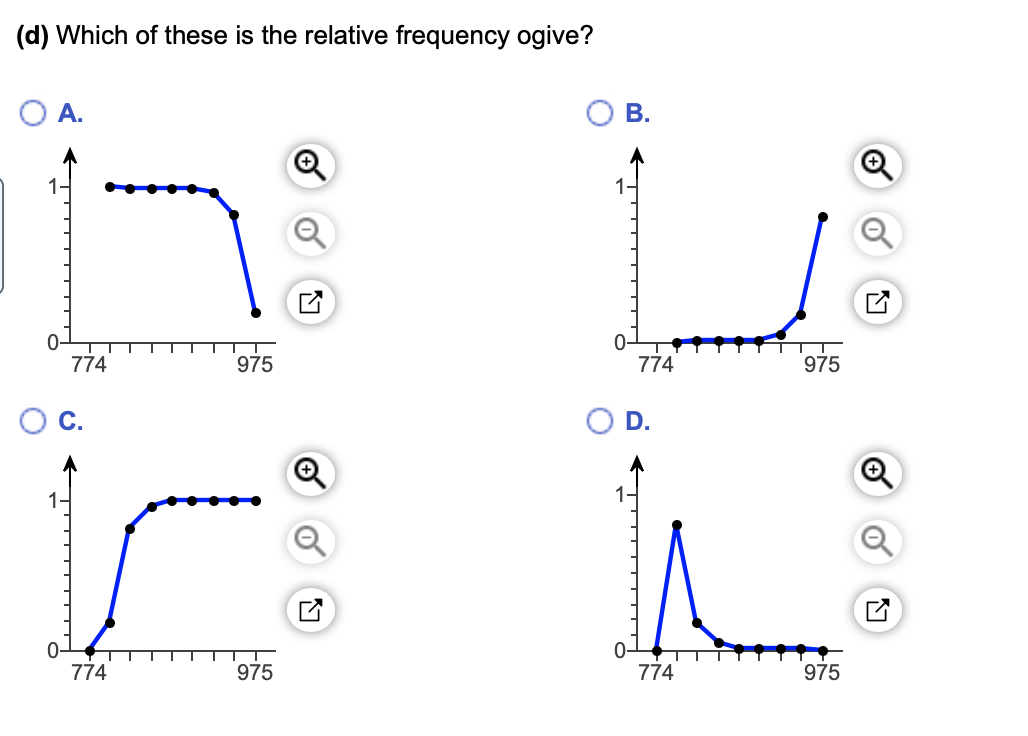
The data in the table represent the tuition for all 2-year community colleges in a region in 2014-2015. (a) Complete the cumulative frequency distribution. (a) Construct a cumulative frequency distribution. Tuition (dollars) Cumulative (b) Construct a cumulative relative frequency distribution. Frequency c) Draw a frequency polygon. d) Draw a relative frequency ogive. 775-799 800-824 Number of Tuition (dollars) Community Colleges 825-849 775-799 21 850-874 800-824 68 875-899 825-849 15 850-874 4 900-924 875-899 0 925-949 900-924 0 950-974 925-949 0 950-974 1(b) Complete the cumulative relative frequency distribution. Tuition (dollars) Cumulative Relative Frequency 775-799 800-824 825-849 850-874 875-899 900-924 925-949 950-974 Round to three decimal places as needed.)(c) Which of these is the frequency polygon? O A. O B. 80-1 + 801 + 762.5 T 1987.5 762.5 TTT 1987.5 O C. O D. 80-7 + 80-7 + 762.51 1 1 1987.5 762 5 T 1987.5(d) Which of these is the relative frequency ogive? O A. O B. + + 0- TTTTTT 0- T 774 975 774 975 O C. O D. + + TTT 774 975 774 975
Step by Step Solution
There are 3 Steps involved in it

Get step-by-step solutions from verified subject matter experts