

Question: The data in the table represents the tuition for all 2 year community colleges in a region in 2014-2015. (a) Construct a cumulative frequency distribution.
The data in the table represents the tuition for all 2 year community colleges in a region in 2014-2015.
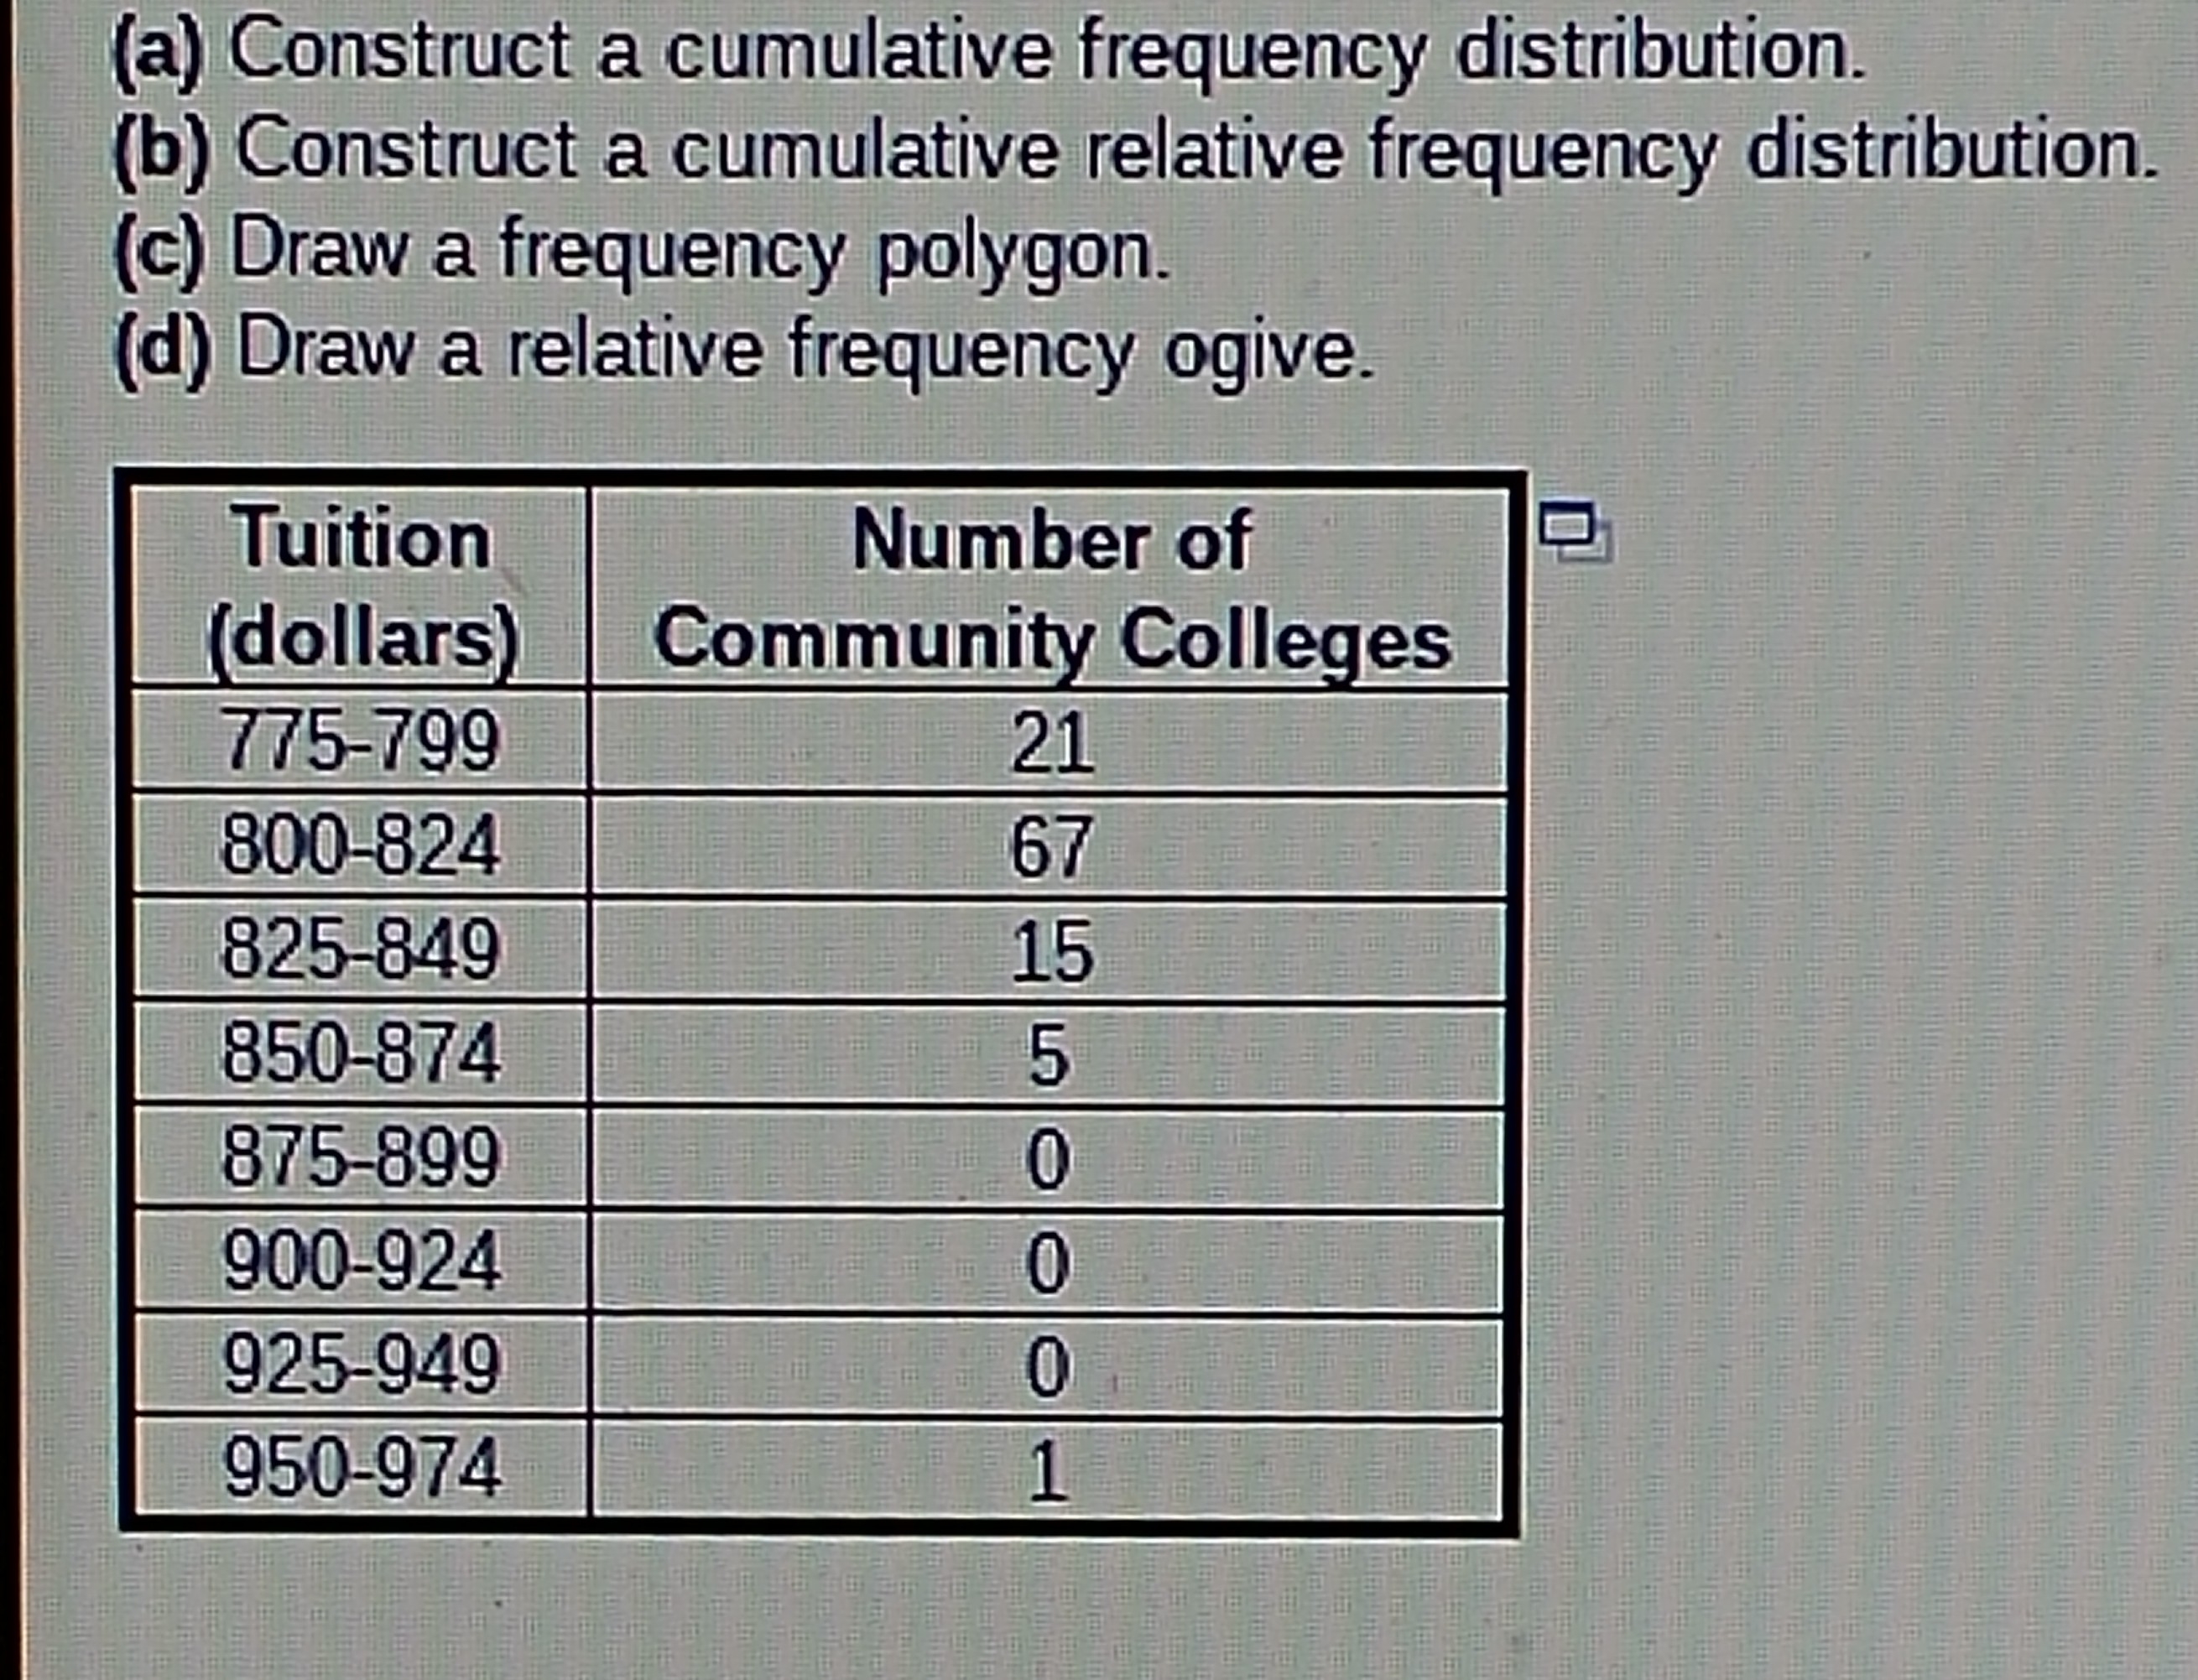
(a) Construct a cumulative frequency distribution. (b) Construct a cumulative relative frequency distribution. (c) Draw a frequency polygon. (d) Draw a relative frequency ogive. Tuition Number of dollars Community Colleges 775-799 21 800-824 67 825-849 15 850-874 875-899 900-924 925-949 950-974 O O O U
Step by Step Solution
There are 3 Steps involved in it
1 Expert Approved Answer
Step: 1 Unlock

Question Has Been Solved by an Expert!
Get step-by-step solutions from verified subject matter experts
Step: 2 Unlock
Step: 3 Unlock