

Question: The data in the table were gathered from 16 computer technicians who have completed a two year college diploma course YEARS EXPERIENCE 3 12 1
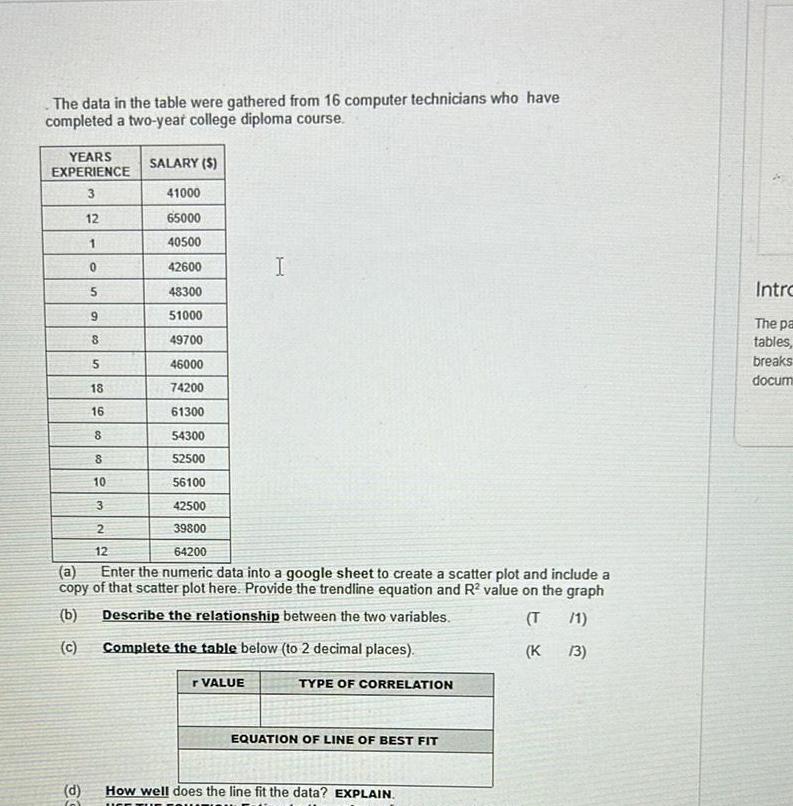

The data in the table were gathered from 16 computer technicians who have completed a two year college diploma course YEARS EXPERIENCE 3 12 1 0 41000 65000 40500 42600 48300 51000 49700 46000 74200 61300 54300 52500 56100 42500 39800 64200 a Enter the numeric data into a google sheet to create a scatter plot and include a copy of that scatter plot here Provide the trendline equation and R value on the graph b Describe the relationship between the two variables T 1 c Complete the table below to 2 decimal places K 13 r VALUE d 0 5 9 8 5 18 16 8 8 10 3 SALARY 2 12 I TYPE OF CORRELATION EQUATION OF LINE OF BEST FIT How well does the line fit the data EXPLAIN UCE Intro The pa tables breaks docum
Step by Step Solution
There are 3 Steps involved in it

Get step-by-step solutions from verified subject matter experts