Question: The data is all provided. If you read the portion to the right everything needed should be stated in part A. I believe that last
The data is all provided. If you read the portion to the right everything needed should be stated in part A. I believe that last years data is 1,926 and 1,400. This years data is 1,508 and 2,011. Thank you again!
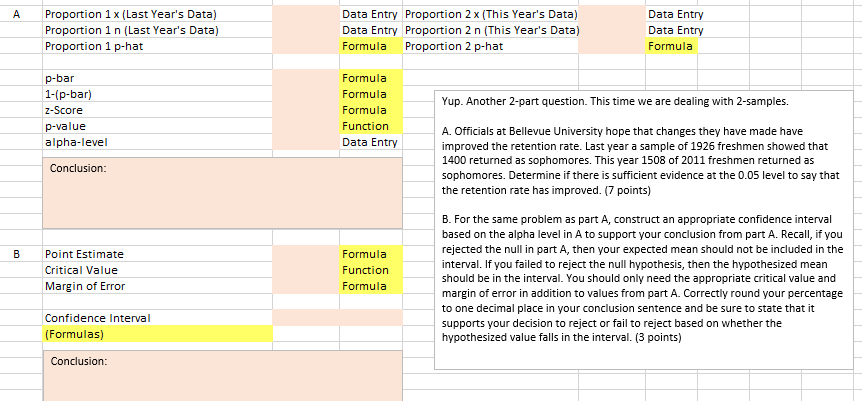
Please only answer if you are able to include the formulas/functions in excel form!! I need these to be included with the correct final answer.
Thank you so much in advance and I will rate positively :)
**Here is a picture of how a Chegg expert answered a similar question that was very helpful. If you could answer it like this, I would really appreciate it!
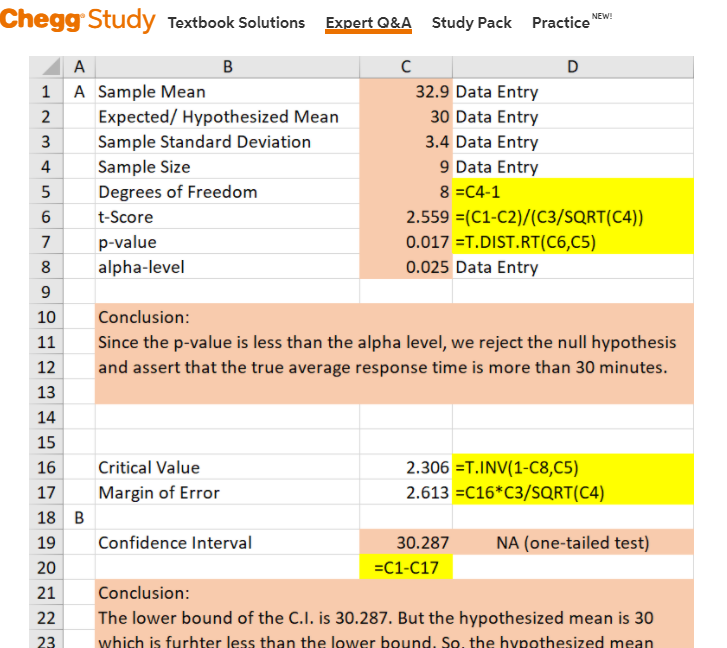
Proportion 1 x (Last Year's Data) Proportion 1 n (Last Year's Data) Proportion 1 p-hat Data Entry Proportion 2x (This Year's Data) Data Entry Proportion 2 n (This Year's Data) Formula Proportion 2 p-hat Data Entry Data Entry Formula Yup. Another 2-part question. This time we are dealing with 2-samples. p-bar 1-(p-bar) z-Score p-value alpha-level Formula Formula Formula Function Data Entry Conclusion: A. Officials at Bellevue University hope that changes they have made have improved the retention rate. Last year a sample of 1926 freshmen showed that 1400 returned as sophomores. This year 1508 of 2011 freshmen returned as sophomores. Determine if there is sufficient evidence at the 0.05 level to say that the retention rate has improved. (7 points) B. For the same problem as part A, construct an appropriate confidence interval based on the alpha level in A to support your conclusion from part A. Recall, if you rejected the null in part A, then your expected mean should not be included in the interval. If you failed to reject the null hypothesis, then the hypothesized mean should be in the interval. You should only need the appropriate critical value and margin of error in addition to values from part A. Correctly round your percentage to one decimal place in your conclusion sentence and be sure to state that it supports your decision to reject or fail to reject based on whether the hypothesized value falls in the interval. (3 points) B Point Estimate Critical Value Margin of Error Formula Function Formula Confidence interval (Formulas) Conclusion: NEW! Chegg Study Textbook Solutions Expert Q&A Study Pack 2 9 11 A B D 1 A Sample Mean 32.9 Data Entry 2 Expected/ Hypothesized Mean 30 Data Entry 3 Sample Standard Deviation 3.4 Data Entry 4 Sample Size 9 Data Entry 5 Degrees of Freedom 8 =C4-1 6 t-Score 2.559 =(C1-C2)/(C3/SQRT(C4)) 7 p-value 0.017 =T.DIST.RT(C6,C5) 8 alpha-level 0.025 Data Entry 9 10 Conclusion: Since the p-value is less than the alpha level, we reject the null hypothesis 12 and assert that the true average response time is more than 30 minutes. 13 14 15 16 Critical Value 2.306 =T.INV(1-C8,C5) 17 Margin of Error 2.613 =C16*C3/SQRT(C4) 18 B 19 Confidence Interval 30.287 NA (one-tailed test) 20 =C1-C17 21 Conclusion: 22 The lower bound of the C.I. is 30.287. But the hypothesized mean is 30 23 which is furhter less than the lower bound. So, the hypothesized mean Proportion 1 x (Last Year's Data) Proportion 1 n (Last Year's Data) Proportion 1 p-hat Data Entry Proportion 2x (This Year's Data) Data Entry Proportion 2 n (This Year's Data) Formula Proportion 2 p-hat Data Entry Data Entry Formula Yup. Another 2-part question. This time we are dealing with 2-samples. p-bar 1-(p-bar) z-Score p-value alpha-level Formula Formula Formula Function Data Entry Conclusion: A. Officials at Bellevue University hope that changes they have made have improved the retention rate. Last year a sample of 1926 freshmen showed that 1400 returned as sophomores. This year 1508 of 2011 freshmen returned as sophomores. Determine if there is sufficient evidence at the 0.05 level to say that the retention rate has improved. (7 points) B. For the same problem as part A, construct an appropriate confidence interval based on the alpha level in A to support your conclusion from part A. Recall, if you rejected the null in part A, then your expected mean should not be included in the interval. If you failed to reject the null hypothesis, then the hypothesized mean should be in the interval. You should only need the appropriate critical value and margin of error in addition to values from part A. Correctly round your percentage to one decimal place in your conclusion sentence and be sure to state that it supports your decision to reject or fail to reject based on whether the hypothesized value falls in the interval. (3 points) B Point Estimate Critical Value Margin of Error Formula Function Formula Confidence interval (Formulas) Conclusion: NEW! Chegg Study Textbook Solutions Expert Q&A Study Pack 2 9 11 A B D 1 A Sample Mean 32.9 Data Entry 2 Expected/ Hypothesized Mean 30 Data Entry 3 Sample Standard Deviation 3.4 Data Entry 4 Sample Size 9 Data Entry 5 Degrees of Freedom 8 =C4-1 6 t-Score 2.559 =(C1-C2)/(C3/SQRT(C4)) 7 p-value 0.017 =T.DIST.RT(C6,C5) 8 alpha-level 0.025 Data Entry 9 10 Conclusion: Since the p-value is less than the alpha level, we reject the null hypothesis 12 and assert that the true average response time is more than 30 minutes. 13 14 15 16 Critical Value 2.306 =T.INV(1-C8,C5) 17 Margin of Error 2.613 =C16*C3/SQRT(C4) 18 B 19 Confidence Interval 30.287 NA (one-tailed test) 20 =C1-C17 21 Conclusion: 22 The lower bound of the C.I. is 30.287. But the hypothesized mean is 30 23 which is furhter less than the lower bound. So, the hypothesized mean


