

Question: the data is given by this Exel. For 1E, the submission day is 3rd of May. Question 1. Forecasting (20 marks) The forecasting techniques introduced
the data is given by this Exel. For 1E, the submission day is 3rd of May.
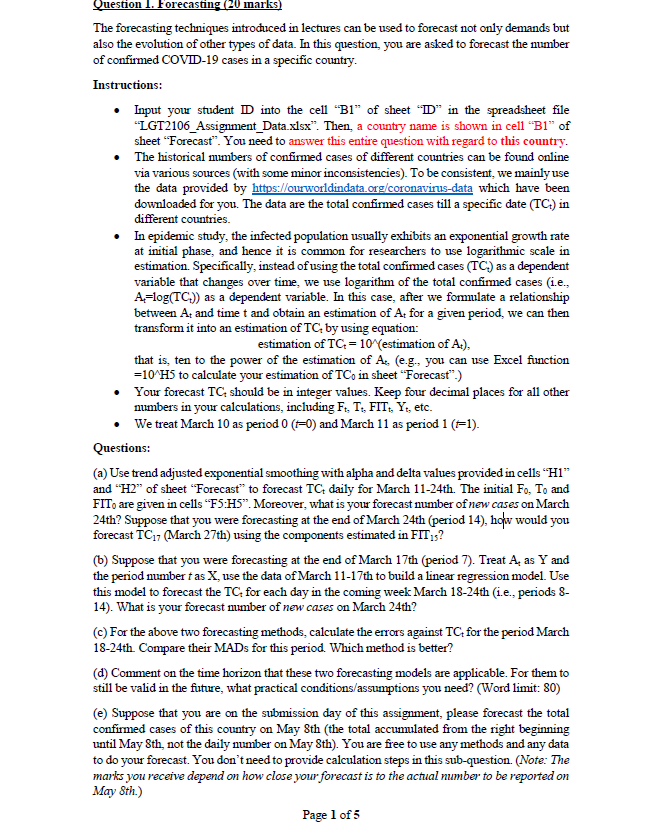
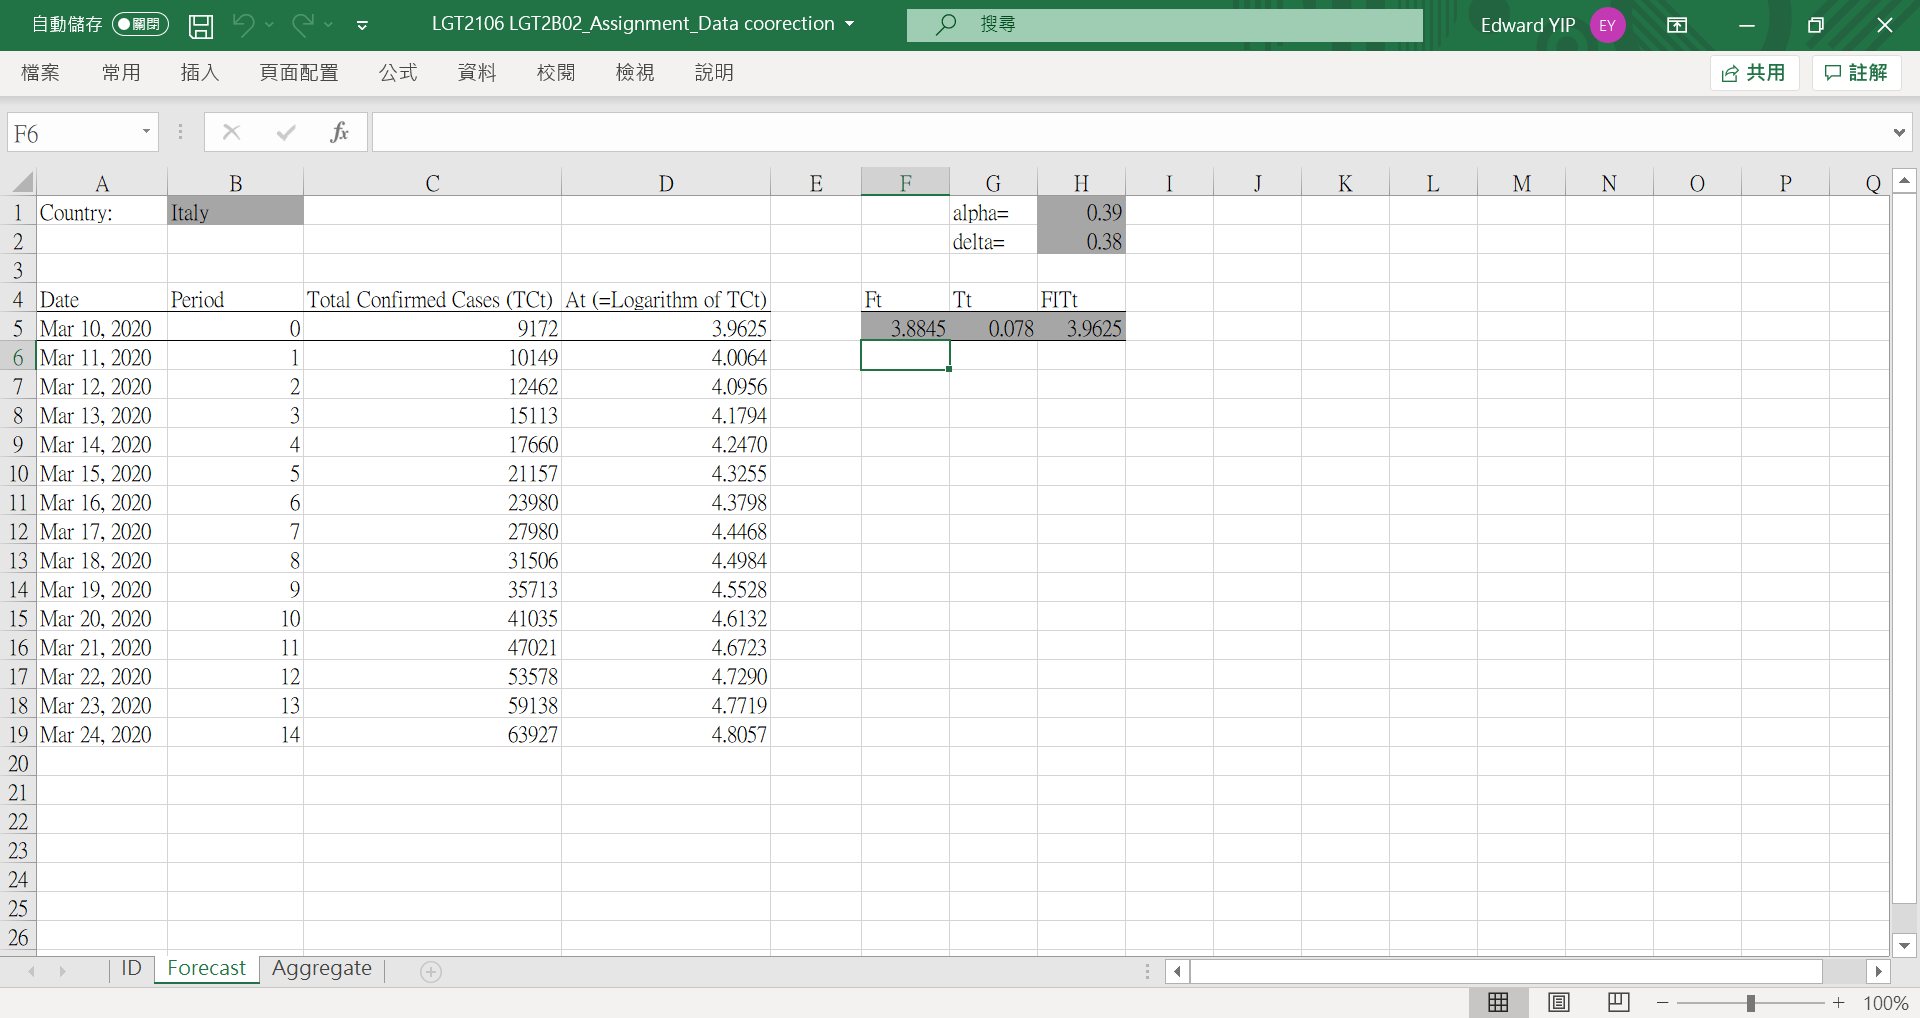
Question 1. Forecasting (20 marks) The forecasting techniques introduced in lectures can be used to forecast not only demands but also the evolution of other types of data. In this question, you are asked to forecast the number of confirmed COVID-19 cases in a specific country. Instructions: Input your student D into the cell "Bl" of sheet"ID" in the spreadsheet file "LGT2106_Assignment_Data.xlsx". Then, a country name is shown in cell "B1" of sheet "Forecast". You need to answer this entire question with regard to this country. The historical mmbers of confirmed cases of different countries can be found online via various sources (with some minor inconsistencies). To be consistent, we mainly use the data provided by https://ourworldindata.org/coronavirus-data which have been downloaded for you. The data are the total confirmed cases till a specific date (TCt) in different countries. In epidemic study, the infected population usually exhibits an exponential growth rate at initial phase, and hence it is common for researchers to use logarithmic scale in estimation. Specifically, instead of using the total confirmed cases (TC) as a dependent variable that changes over time, we use logarithm of the total confirmed cases i.e., A=log(TC.)) as a dependent variable. In this case, after we fomulate a relationship between At and time t and obtain an estimation of At for a given period, we can then transform it into an estimation of TC by using equation: estimation of TC = 10 (estimation of At), that is, ten to the power of the estimation of A. (e.g. you can use Excel function =10 H5 to calculate your estimation of TCo in sheet Forecast".) Your forecast TC should be in integer values. Keep four decimal places for all other numbers in your calculations, including Ft, T, FIT, Yt, etc. We treat March 10 as period 0 (0) and March 11 as period 1 (==1). Questions: (a) Use trend adjusted exponential smoothing with alpha and delta values provided in cells H1" and "H2" of sheet "Forecast to forecast TC daily for March 11-24th. The initial Fo, To and FIT, are given in cells "F5:HS". Moreover, what is your forecast number of new cases on March 24th? Suppose that you were forecasting at the end of March 24th (period 14), how would you forecast TC17 March 27th) using the components estimated in FIT 3? (b) Suppose that you were forecasting at the end of March 17th (period 7). Treat A, as Y and the period number tas X, use the data of March 11-17th to build a linear regression model. Use this model to forecast the TC for each day in the coming week March 18-24th (i.e., periods S- 14). What is your forecast mumber of new cases on March 24th? (c) For the above two forecasting methods, calculate the errors against TC for the period March 18-24th. Compare their MADs for this period. Which method is better? (d) Comment on the time horizon that these two forecasting models are applicable. For them to still be valid in the future, what practical conditions/assumptions you need? (Word limit: 80) (e) Suppose that you are on the submission day of this assignment, please forecast the total confirmed cases of this country on May 8th (the total accumulated from the right beginning until May Sth, not the daily number on May 8th). You are free to use any methods and any data to do your forecast. You don't need to provide calculation steps in this sub-question. (Note: The marks you receive depend on how close your forecast is to the actual number to be reported on May 8th.) Page 1 of 5 0 1 Edward YIP EY 54347 0 H D - LGT2106 LGT2B02_Assignment_Data coorection - | , - ## F6 : x for E F H 0.39 I J K L M N O P Q A 1 Country: G alpha= delta= Italy 2 0.38 3 Period Ft Tt 3.8845 FITT 0.078 3.9625 4 Date 5 Mar 10, 2020 6 Mar 11, 2020 7 Mar 12, 2020 8 Mar 13, 2020 9 Mar 14, 2020 10 Mar 15, 2020 | 11 Mar 16, 2020 12 Mar 17, 2020 13 Mar 18, 2020 14 Mar 19, 2020 15 Mar 20, 2020 | 16 Mar 21, 2020 17 Mar 22, 2020 18 Mar 23, 2020 19 Mar 24, 2020 Total Confirmed Cases (TCt) At (=Logarithm of TCt) 9172 3.9625 10149 4.0064 12462 4.0956 15113 4.1794 17660 4.2470 21157 4.3255 23980 4.3798 27980 4.4468 31506 4.4984 35713 4.5528 41035 4.6132 47021 4.6723 53578 4.7290 59138 4.7719 63927 4.8057 ID Forecast Aggregate @ - - - + 100% Question 1. Forecasting (20 marks) The forecasting techniques introduced in lectures can be used to forecast not only demands but also the evolution of other types of data. In this question, you are asked to forecast the number of confirmed COVID-19 cases in a specific country. Instructions: Input your student D into the cell "Bl" of sheet"ID" in the spreadsheet file "LGT2106_Assignment_Data.xlsx". Then, a country name is shown in cell "B1" of sheet "Forecast". You need to answer this entire question with regard to this country. The historical mmbers of confirmed cases of different countries can be found online via various sources (with some minor inconsistencies). To be consistent, we mainly use the data provided by https://ourworldindata.org/coronavirus-data which have been downloaded for you. The data are the total confirmed cases till a specific date (TCt) in different countries. In epidemic study, the infected population usually exhibits an exponential growth rate at initial phase, and hence it is common for researchers to use logarithmic scale in estimation. Specifically, instead of using the total confirmed cases (TC) as a dependent variable that changes over time, we use logarithm of the total confirmed cases i.e., A=log(TC.)) as a dependent variable. In this case, after we fomulate a relationship between At and time t and obtain an estimation of At for a given period, we can then transform it into an estimation of TC by using equation: estimation of TC = 10 (estimation of At), that is, ten to the power of the estimation of A. (e.g. you can use Excel function =10 H5 to calculate your estimation of TCo in sheet Forecast".) Your forecast TC should be in integer values. Keep four decimal places for all other numbers in your calculations, including Ft, T, FIT, Yt, etc. We treat March 10 as period 0 (0) and March 11 as period 1 (==1). Questions: (a) Use trend adjusted exponential smoothing with alpha and delta values provided in cells H1" and "H2" of sheet "Forecast to forecast TC daily for March 11-24th. The initial Fo, To and FIT, are given in cells "F5:HS". Moreover, what is your forecast number of new cases on March 24th? Suppose that you were forecasting at the end of March 24th (period 14), how would you forecast TC17 March 27th) using the components estimated in FIT 3? (b) Suppose that you were forecasting at the end of March 17th (period 7). Treat A, as Y and the period number tas X, use the data of March 11-17th to build a linear regression model. Use this model to forecast the TC for each day in the coming week March 18-24th (i.e., periods S- 14). What is your forecast mumber of new cases on March 24th? (c) For the above two forecasting methods, calculate the errors against TC for the period March 18-24th. Compare their MADs for this period. Which method is better? (d) Comment on the time horizon that these two forecasting models are applicable. For them to still be valid in the future, what practical conditions/assumptions you need? (Word limit: 80) (e) Suppose that you are on the submission day of this assignment, please forecast the total confirmed cases of this country on May 8th (the total accumulated from the right beginning until May Sth, not the daily number on May 8th). You are free to use any methods and any data to do your forecast. You don't need to provide calculation steps in this sub-question. (Note: The marks you receive depend on how close your forecast is to the actual number to be reported on May 8th.) Page 1 of 5 0 1 Edward YIP EY 54347 0 H D - LGT2106 LGT2B02_Assignment_Data coorection - | , - ## F6 : x for E F H 0.39 I J K L M N O P Q A 1 Country: G alpha= delta= Italy 2 0.38 3 Period Ft Tt 3.8845 FITT 0.078 3.9625 4 Date 5 Mar 10, 2020 6 Mar 11, 2020 7 Mar 12, 2020 8 Mar 13, 2020 9 Mar 14, 2020 10 Mar 15, 2020 | 11 Mar 16, 2020 12 Mar 17, 2020 13 Mar 18, 2020 14 Mar 19, 2020 15 Mar 20, 2020 | 16 Mar 21, 2020 17 Mar 22, 2020 18 Mar 23, 2020 19 Mar 24, 2020 Total Confirmed Cases (TCt) At (=Logarithm of TCt) 9172 3.9625 10149 4.0064 12462 4.0956 15113 4.1794 17660 4.2470 21157 4.3255 23980 4.3798 27980 4.4468 31506 4.4984 35713 4.5528 41035 4.6132 47021 4.6723 53578 4.7290 59138 4.7719 63927 4.8057 ID Forecast Aggregate @ - - - + 100%Step by Step Solution
There are 3 Steps involved in it
1 Expert Approved Answer
Step: 1 Unlock

Question Has Been Solved by an Expert!
Get step-by-step solutions from verified subject matter experts
Step: 2 Unlock
Step: 3 Unlock