

The data represents the heights of eruptions by a geyser. Use the heights to construct a stemplot.
Fantastic news! We've Found the answer you've been seeking!
Question:
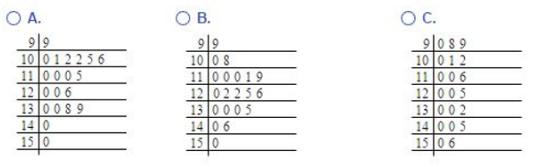
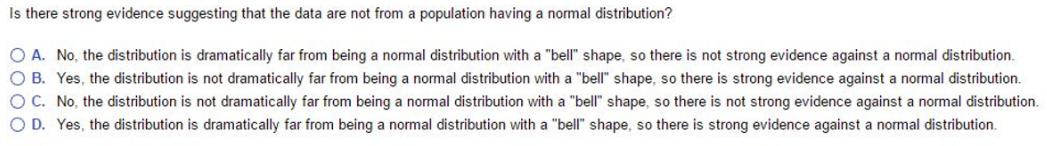
The data represents the heights of eruptions by a geyser. Use the heights to construct a stemplot. Is there strong evidence suggesting that the data are not from a population having a normal distribution?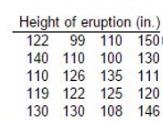 Which plot represents a stem plot of the data?
Expert Answer:

Related Book For 

Introduction to Statistical Investigations
ISBN: 978-1118922002
1st edition
Authors: Beth L.Chance, George W.Cobb, Allan J.Rossman Nathan Tintle, Todd Swanson Soma Roy
Posted Date:
