

Question: * The data represents the maximum wind speed( in knots) and atmospheric pressure (in millibars) for a random sample of hurricanes that originated in the
* The data represents the maximum wind speed( in knots) and atmospheric pressure (in millibars) for a random sample of hurricanes that originated in the Atlantic Ocean 1. Draw a scatter diagram treating atmospheric pressure as the explanatory variable. Include title and and axes label. 2. Compute the linear correlation coefficient between atmospheric pressure and wind speed. 3. Does the linear relation exist between atmospheric pressure and wind speed? Show work if possible. Thank you!
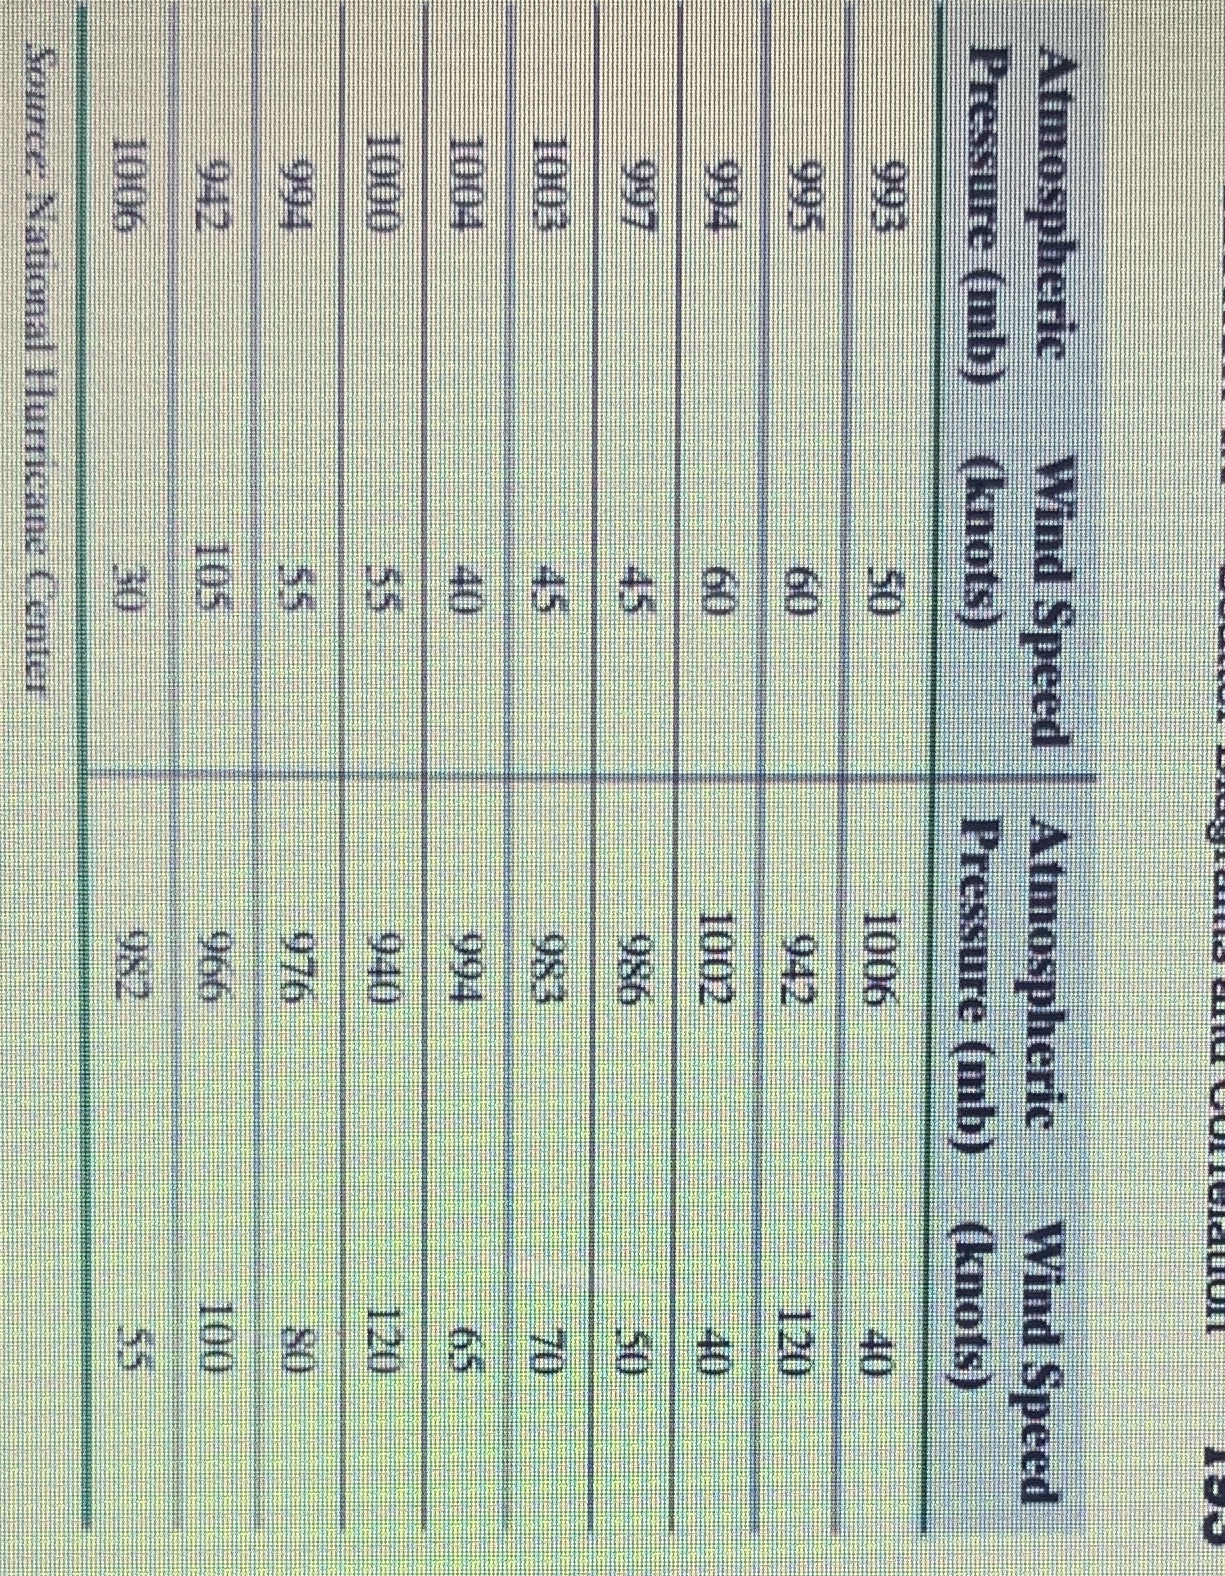
Atmospheric Wind Speed Atmospheric Wind Speed Pressure (mb) (knots) Pressure (mb) (knots) 993 1006 995 942 120 g94 1002 2 997 986 R 1003 983 1004 994 212 1000 940 120 994 976 942 966 100 1006 Source: National Hurricane Center
Step by Step Solution
There are 3 Steps involved in it

Get step-by-step solutions from verified subject matter experts