

Question: The data set for this exercise comes from the book: Kunner, Nachtshelm, Neter and Li (2005), Applied Linear Statistical Models, fifth edition. In a study
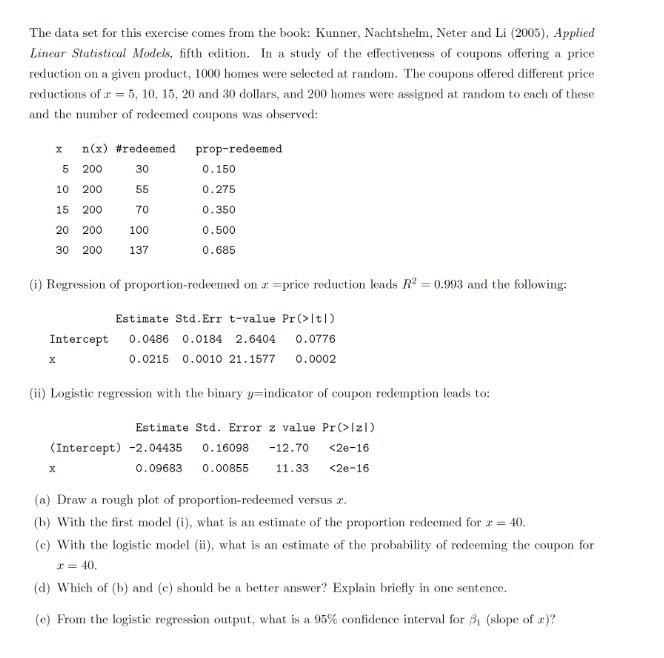

The data set for this exercise comes from the book: Kunner, Nachtshelm, Neter and Li (2005), Applied Linear Statistical Models, fifth edition. In a study of the effectiveness of coupons offering a price reduction on a given product, 1000 homes were selected at random. The coupons offered different price reductions of r = 5, 10, 15, 20 and 30 dollars, and 200 homes were assigned at random to each of these and the number of redeemed coupons was observed: n(x) #redeemed prop-redeemed 5 200 30 0. 150 10 200 65 0. 275 15 70 0. 350 20 200 100 0. 500 30 200 137 0. 685 (i) Regression of proportion-redeemed on a =price reduction leads R- = 0.993 and the following: Estimate Std. Err t-value Pr(>|t[ ) Intercept 0.0486 0.0184 2.6404 0.0776 X 0. 0215 0.0010 21.1577 0. 0002 (ii) Logistic regression with the binary y=indicator of coupon redemption leads to: Estimate Std. Error z value Pr(>|zl) (Intercept) -2.04435 0. 16098 -12.70
Step by Step Solution
There are 3 Steps involved in it

Get step-by-step solutions from verified subject matter experts