

Question: the data set is huge so cant post screen shot by y segment = 1000 values average = 20.748 sum 20748 standard deviation 25.8136651 for
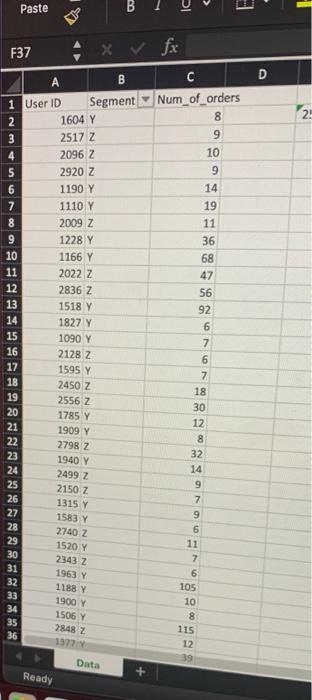
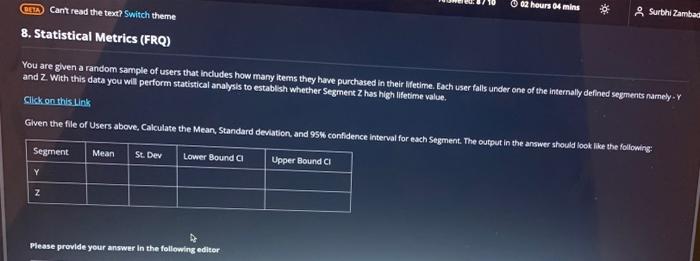
ALL 9. Understanding of Statistical Metrics (FRQ) You are given a random sample of users that includes how many items they have purchased in their lifetime. Each uses talls under one of the Internally defined segments namely: Y and Z. With this data you will perform statistical analysis to establish whether Segment has high lifetime value Given the numbers calculated in the last question, Does your analysis mean Segment Zusers are high value users? Why or why not? If not, how would you amend your analysis Please provide your answer in the following editor BIU I Subalt Answer continue B IC C Paste E T E F37 x V fx B D 2: A 1 User ID Segment 2 1604 Y 3 2517 z 2096 Z 2920 Z 6 1190 Y 1110 Y 2009 Z 9 1228 Y 10 1166 Y 11 2022 Z 12 2836 Z 13 1518 Y 14 1827 Y 15 1090 Y 16 2128 2 17 1595 Y 18 2450 Z 19 2556 Z 20 1785 Y 21 1909 Y 22 27982 23 1940 Y 24 2499 Z 25 26 1315 Y 27 28 29 30 31 32 33 34 35 36 Num_of_orders 8 9 10 9 14 19 11 36 68 47 56 92 6 7 6 7 18 30 12 8 32 14 9 7 9 6 11 7 6 105 10 8 115 12 39 NON 2150 Z 1583 Y 2740 Z 1520 Y 2343 Z 1963 Y 1188 Y 1900 Y 1506 Y 2848 Z 1972 Data Ready 9. Understanding of Statistical Metrics (FRQ) You are given a random sample of users that includes how many items they have purchased in their lifetime. Each user falls under one of the internally defined segments namely: Y and Z. With this data you will perform statistical analysis to establish whether Segment 2 has high lifetime value. Given the numbers calculated in the last question, Does your analysis mean segment 2 users are high value users? Why or why not? If not, how would you amend your analysi? Please provide your answer in the following editor BTU *** 1 a Cant read the text? Switch theme 02 hours 04 mins & Surbhi Zambad 8. Statistical Metrics (FRQ) You are gven a random sample of users that includes how many items they have purchased in their lifetime. Each user falls under one of the internally defined segments namely and 2 With this data you will perform statistical analysis to establish whether segment Z has high lifetime value. Click on this link Given the file of users above, Calculate the Mean, Standard deviation, and 95% confidence interval for each Segment. The output in the answer should look like the following Segment Mean St. Dev Lower Sound a Upper Bound CI Y Z Please provide your answer in the following editor
Step by Step Solution
There are 3 Steps involved in it

Get step-by-step solutions from verified subject matter experts