

Question: The data set represents several attributes on data breaches across several organizations. It includes 500 observations and 11 variables. The names and descriptions of each
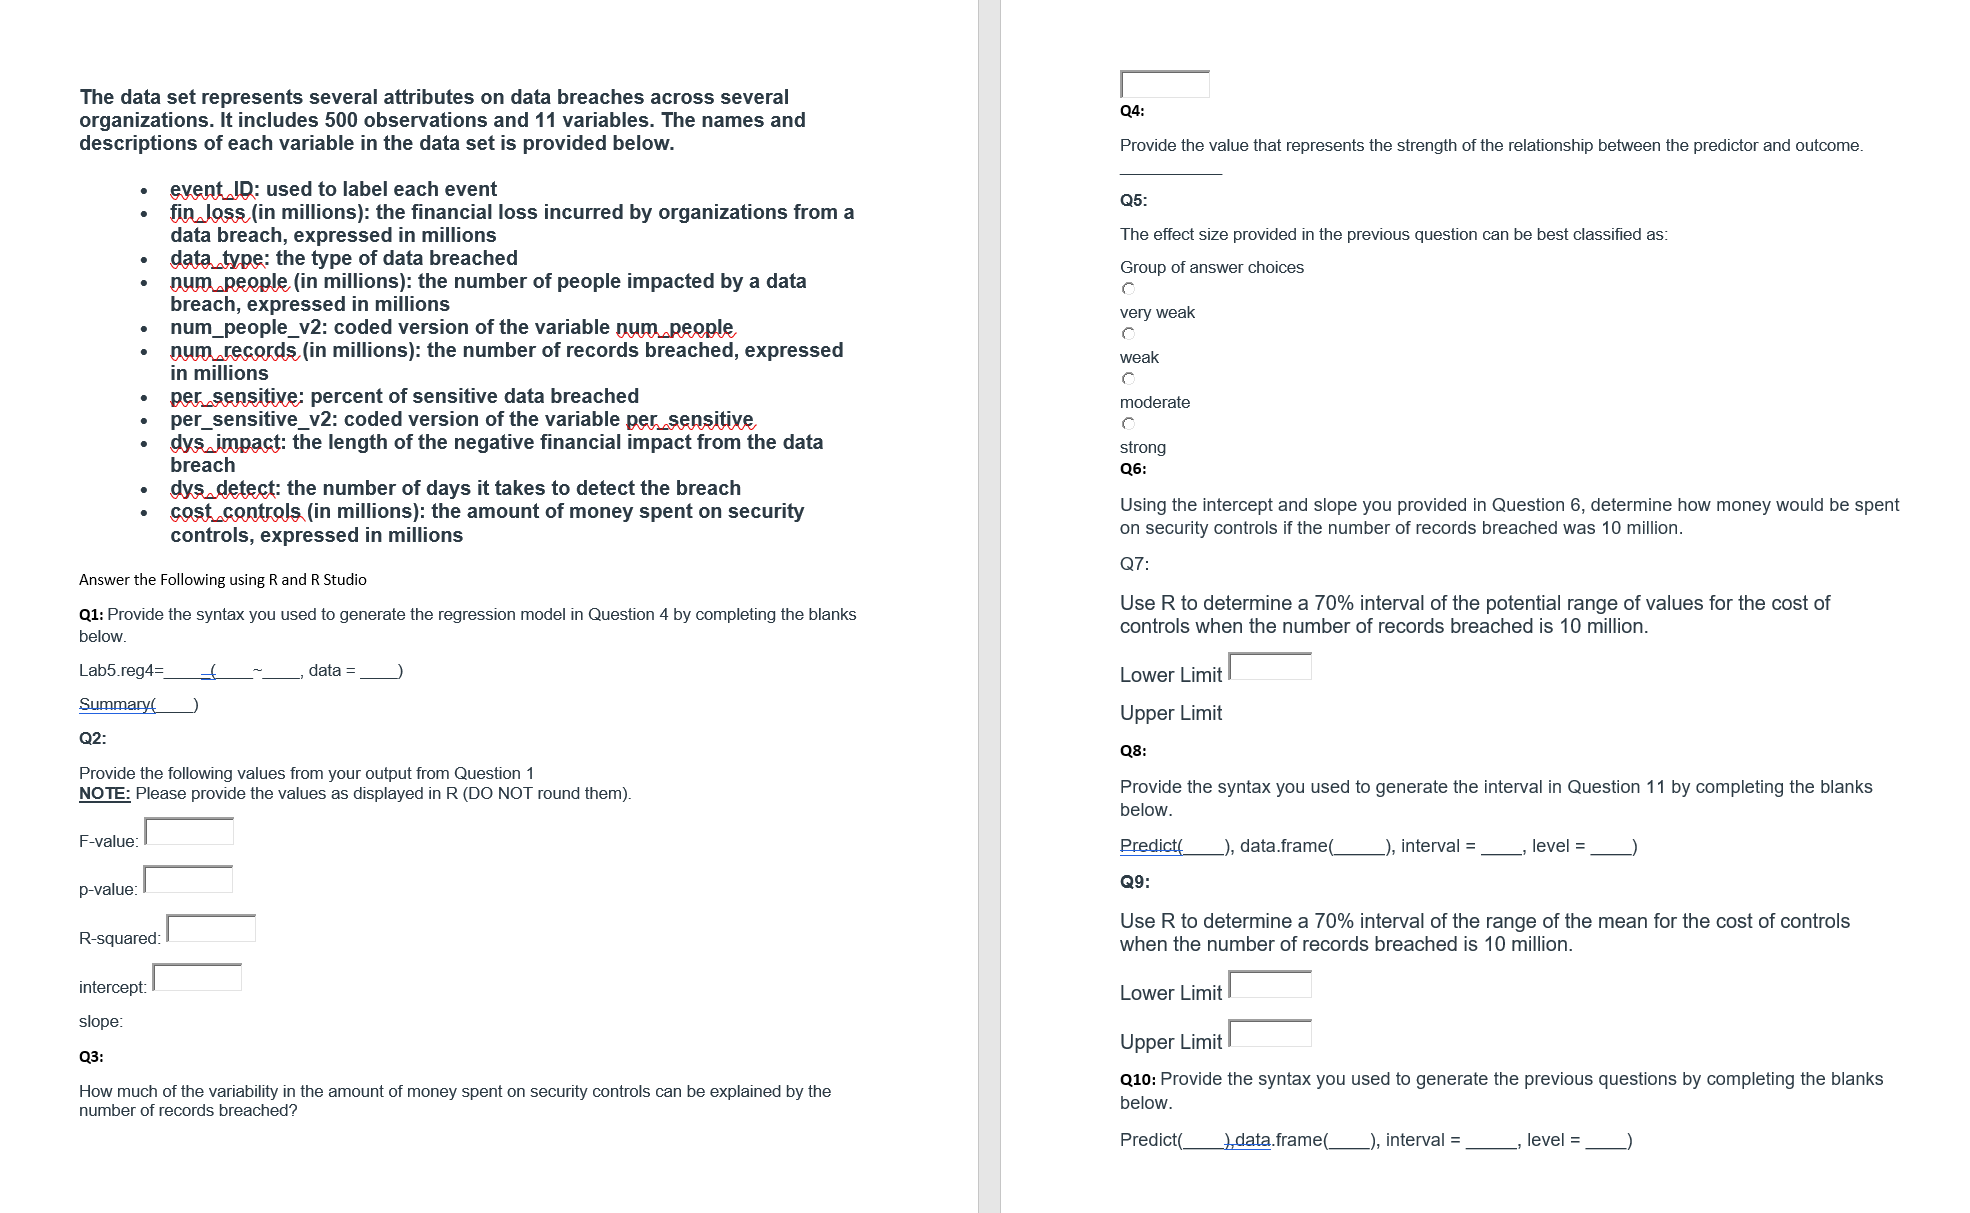
The data set represents several attributes on data breaches across several organizations. It includes 500 observations and 11 variables. The names and descriptions of each variable in the data set is provided below. min: used to label each event mtin mi ons): the nancial loss incurred by organizations from a data breach, expressed in millions W: the type of data breached mn millions): the number of people impacted by a data breach, expressed in millions num_people_v2: coded version of the variable W Wtin millions): the number of records breached, expressed in millions W percent of sensitive data breached per_sensitive_v2: coded version of the variable W W: the length of the negative nancial impact from the data breach W: the number of days it takes to detect the breach WU" millions): the amount of money spent on security controls, expressed in millions Answer the Following using R and RStudio qt: Provide the syntax you used to generate the regr%sion model in Question 4 by completing the blanks below Lah5.reg4: 3 ~ , data : ) SEAl m: Provide the following values from your output from Question 1 NOTE: Please provide the values as displayed In R (DO NOT mund them) Fvalue I ' ovalue: Requared: Intercept I slope. 03: How much of the variability in the amount of money spent on security controls ll" be explained by the number of records breached\") ' Q4: Provide the value that represents the strength of the relationship between the predictor and outcome Q5: The effect size provided in the previous question can be bestclassied as: Group of answer cholo F very weak F weak r. mode rate r. strong Q6: Using the intercept and slope you provided in Question 6, determine how money would be spent on security controls if the number of records breached was 10 million. Q7: Use R to determine a 70% interval of the potential range of values for the cost of controls when the number of records breached is 10 million. Lower Limit I Upper Limit on: Provide the syntax you used to generate the interval in Question 11 by completing the blanks below. My data.trame( ), interval = , level = ) Q9: Use R to determine a 70% interval of the range of the mean for the cost of controls when the number of records breached is 10 million. Lower Limit I Upper Limit I Q10: Provide the syntax you used to generate the previous questions by completing the blanks below. Predict( \\ data.frame( ), interval = , level = )
Step by Step Solution
There are 3 Steps involved in it

Get step-by-step solutions from verified subject matter experts