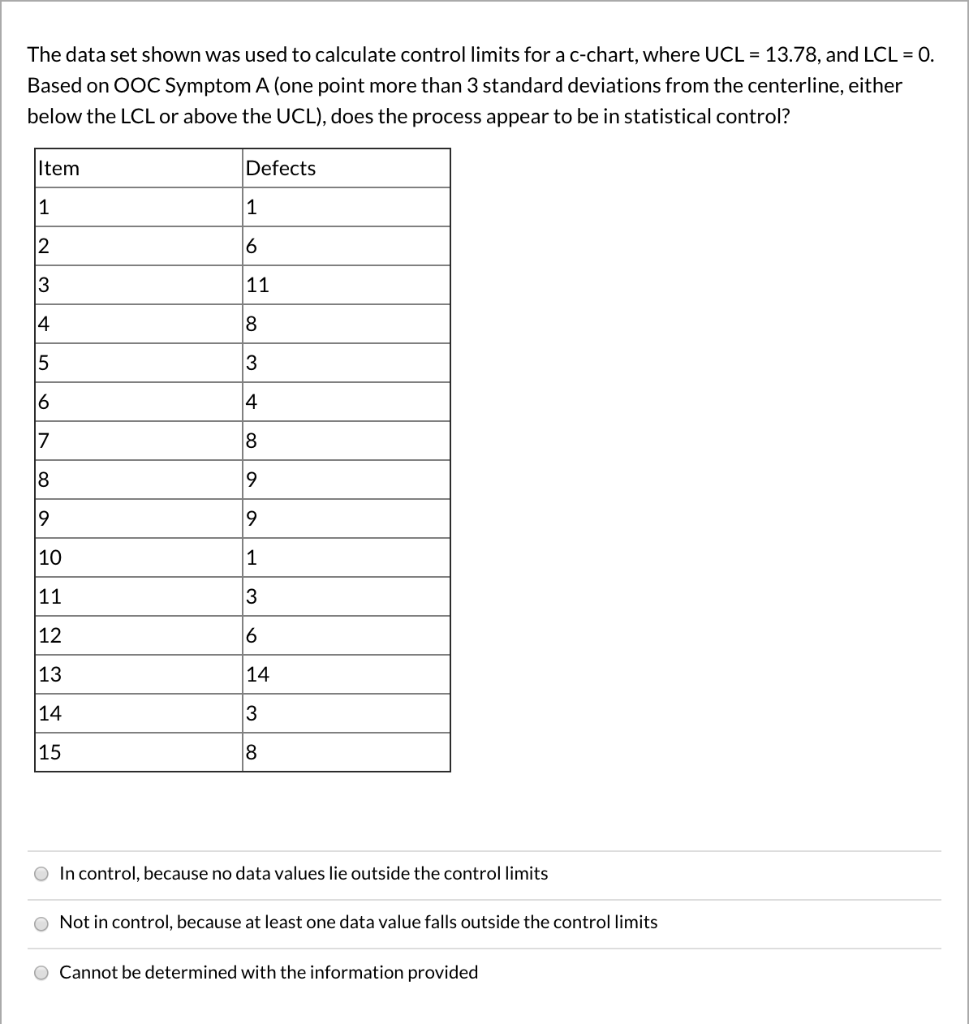
Question: The data set shown was used to calculate control limits for a c-chart, where UCL = 13.78, and LCL = 0. Based on OOC Symptom

The data set shown was used to calculate control

The data set shown was used to calculate control limits for a c-chart, where UCL = 13.78, and LCL = 0. Based on OOC Symptom A (one point more than 3 standard deviations from the centerline, either below the LCL or above the UCL), does the process appear to be in statistical control? Item Defects olno la In control, because no data values lie outside the control limits Not in control, because at least one data value falls outside the control limits Cannot be determined with the information provided

Step by Step Solution

There are 3 Steps involved in it

1 Expert Approved Answer
Step: 1 Unlock blur-text-image
Question Has Been Solved by an Expert!

Get step-by-step solutions from verified subject matter experts

Step: 2 Unlock
Step: 3 Unlock

Students Have Also Explored These Related General Management Questions!