

Question: the data sheet is coming with this project. AutoSave CO 2 StampsC_m23correlation D Search File Home Insert Page Layout Formulas Data Review View Help A
the data sheet is coming with this project.
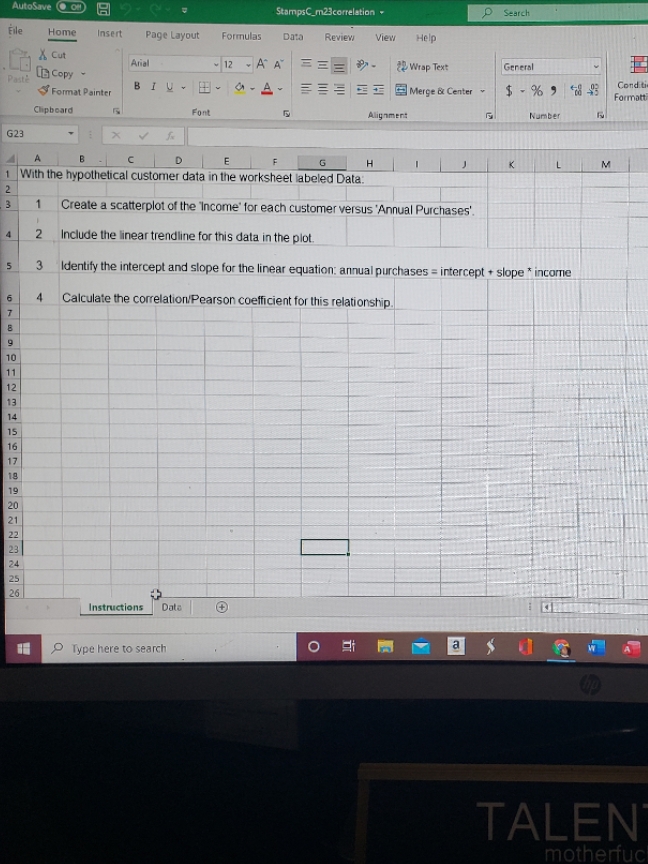
AutoSave CO 2 StampsC_m23correlation D Search File Home Insert Page Layout Formulas Data Review View Help A Cut Arial 12 - A A E Wrap Text General Paste [ Copy BE Merge & Center Cond ti Format Painter Formatt Chipboard Font Alignment Number G23 X V A C D E F G H M With the hypothetical customer data in the worksheet labeled Data: 2 1 Create a scatterplot of the 'Income' for each customer versus 'Annual Purchases'. 2 Include the linear trendline for this data in the plot. 5 3 Identify the intercept and slope for the linear equation: annual purchases = intercept + slope * income 4 Calculate the correlation/Pearson coefficient for this relationship. 10 25 26 Instructions Data Type here to search O Hi A TALEN motherfuc
Step by Step Solution
There are 3 Steps involved in it

Get step-by-step solutions from verified subject matter experts