

Question: The data shown below represent the repair cost for a lowimpact collision in a simple random sample of mini- and micro-vehicles. Complete parts (a) through
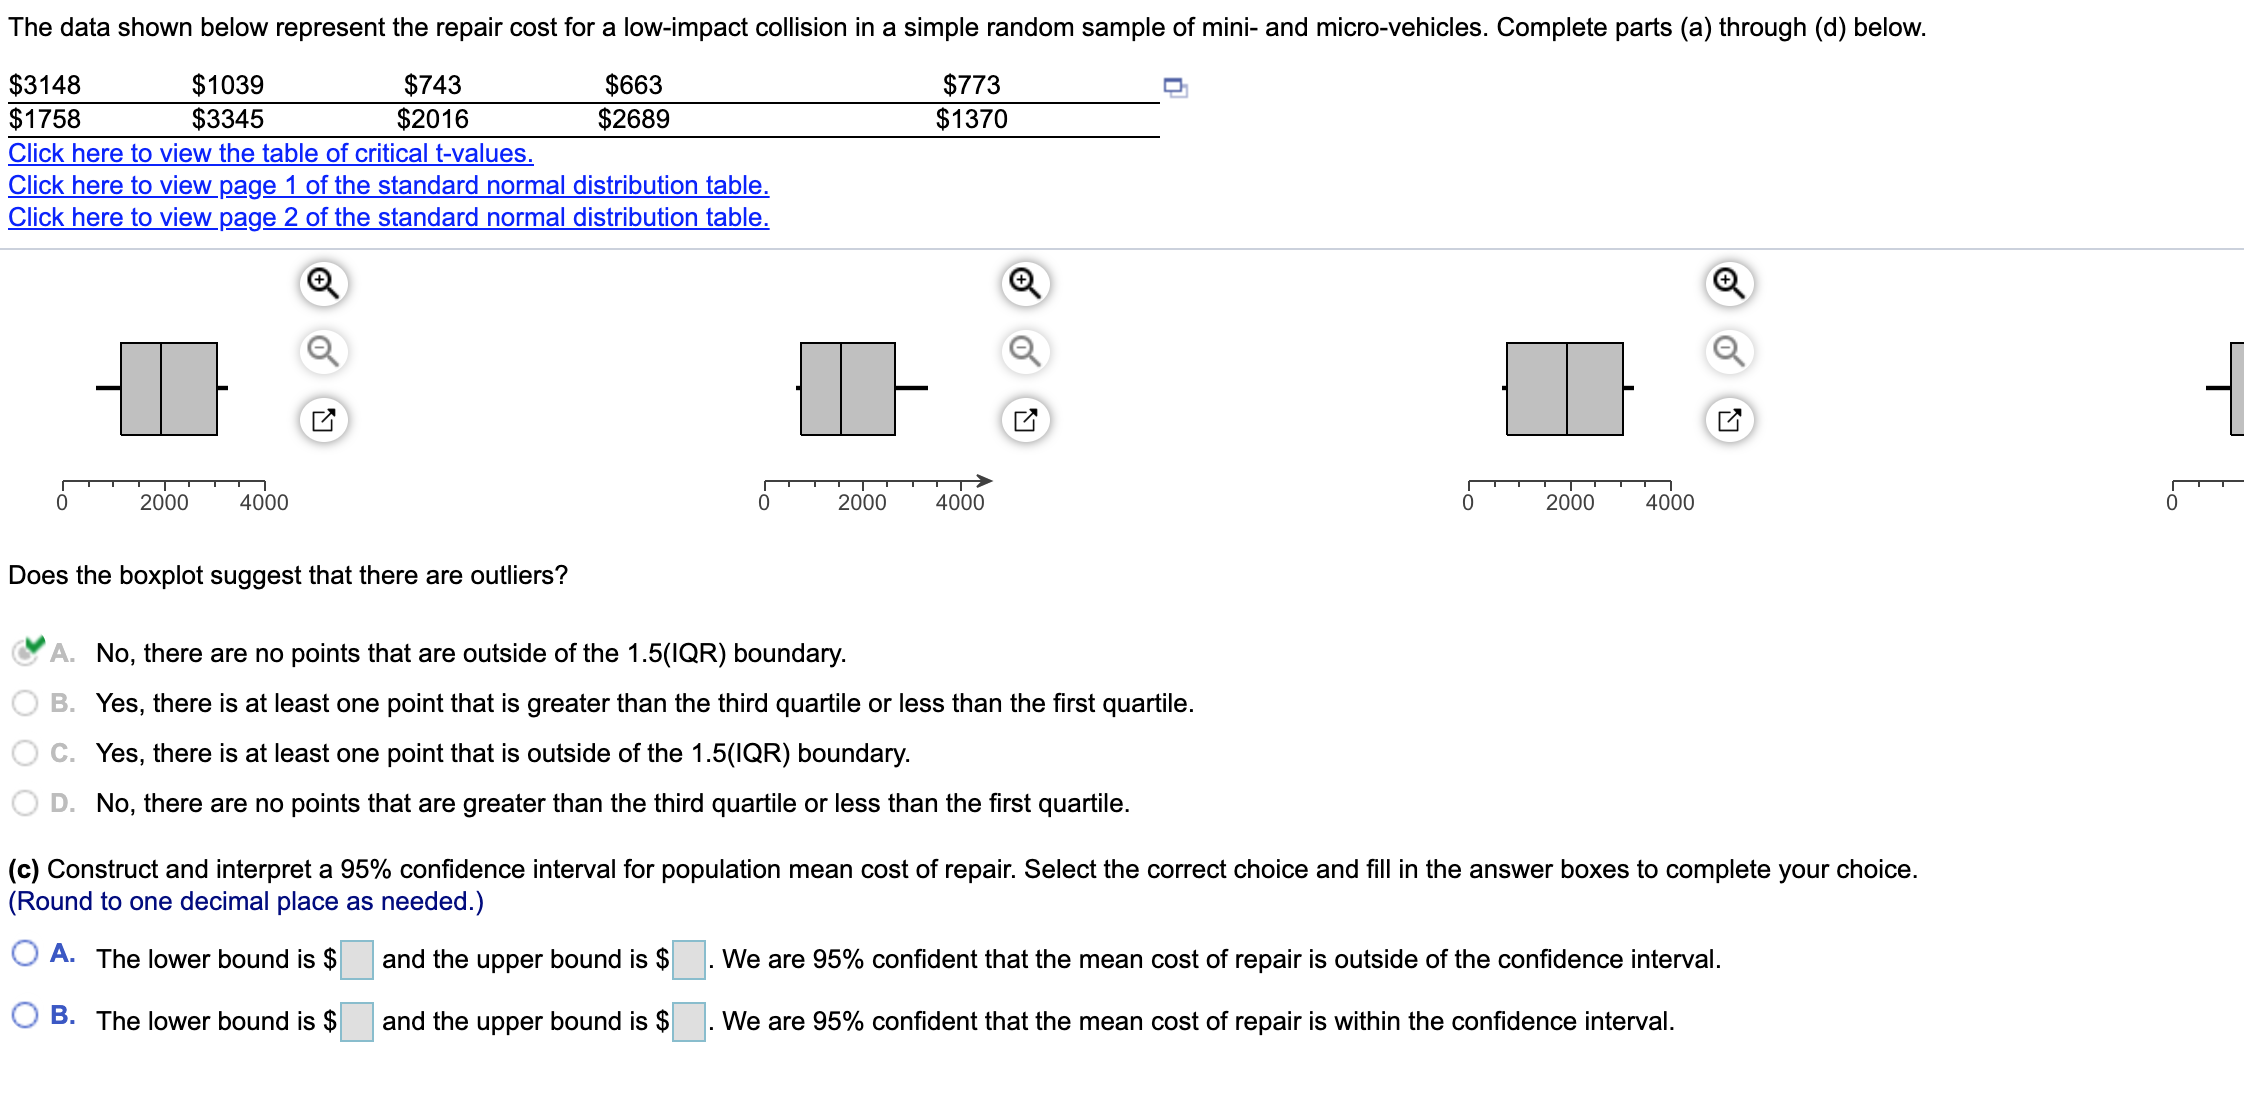
The data shown below represent the repair cost for a lowimpact collision in a simple random sample of mini- and micro-vehicles. Complete parts (a) through (d) below. $3148 $1039 $743 $663 $773 9 $1758 $3345 $2016 $2689 $1370 Click here to view the table of critical tvalues. Click here to view page 1 of the standard normal distribution table. Click here to view page 2 of the standard normal distribution table. Q IQ lo' . g I ,........ ,........> ,........ 0 2000 4000 0 2000 4000 0 2000 4000 43.1 9191 Does the boxplot suggest that there are outliers? .9 A. No, there are no points that are outside of the 1.5(IQR) boundary. B. Yes, there is at least one point that is greater than the third quartile or less than the rst quartile. C. Yes, there is at least one point that is outside of the 1.5(IQR) boundary. D. No, there are no points that are greater than the third quartile or less than the rst quartile. (c) Construct and interpret a 95% condence interval for population mean cost of repair. Select the correct choice and ll in the answer boxes to complete your choice. (Round to one decimal place as needed.) O A- The lower bound is $ and the upper bound is $ . We are 95% condent that the mean cost of repair is outside of the condence interval. O B- The lower bound is $ and the upper bound is $ . We are 95% condent that the mean cost of repair is within the condence interval
Step by Step Solution
There are 3 Steps involved in it

Get step-by-step solutions from verified subject matter experts