

Question: The data shown below represent the repair cost for a? low-impact collision in a simple random sample of? mini- and? micro-vehicles. Complete parts? (a) through?
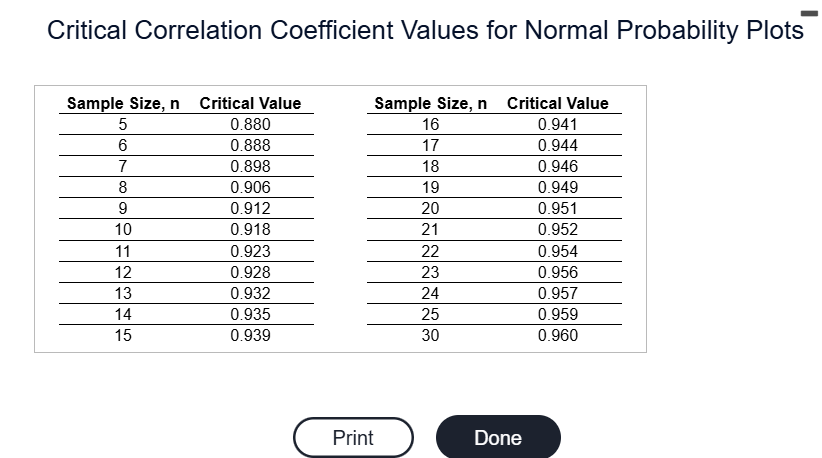
The data shown below represent the repair cost for a? low-impact collision in a simple random sample of? mini- and? micro-vehicles. Complete parts? (a) through? (d) below.$ 3140$ 1065?$729?$661?$782 ?$1717?$3311$ 2089$ 2688?$1337LOADING... Click the icon to view the table of critical correlation coefficient values for normal probability plots.Question content area bottomPart 1?(a) Draw a normal probability plot to determine if it is reasonable to conclude the data come from a population that is normally distributed. Choose the correct answer below.A.020004000-2-1012Repair Cost ($)Expected z-scoreA normal probability plot has a horizontal axis labeled Repair Cost (dollars) from 0 to 4000 in increments of 500 and a vertical axis labeled Expected z-score from negative 2 to 2 in increments of 0.5. The graph contains 10 plotted points that follow the general pattern of a line that rises from left to right through (500, negative 2) and (3000, 2), with slight deviation from the line pattern at the tails. The 10 plotted points have coordinates as follows: (700, negative 1.6); (850, negative 1); (1300, negative 0.6); (1900, negative 0.4); (2300, negative 0.1); (2650, 0.1); (2950, 0.4); (3200, 0.6); (3250, 1); (3350, 1.6). All coordinates are approximate.B.020004000-2-1012Repair Cost ($)Expected z-scoreA normal probability plot has a horizontal axis labeled Repair Cost (dollars) from 0 to 4000 in increments of 500 and a vertical axis labele
Step by Step Solution
There are 3 Steps involved in it

Get step-by-step solutions from verified subject matter experts