

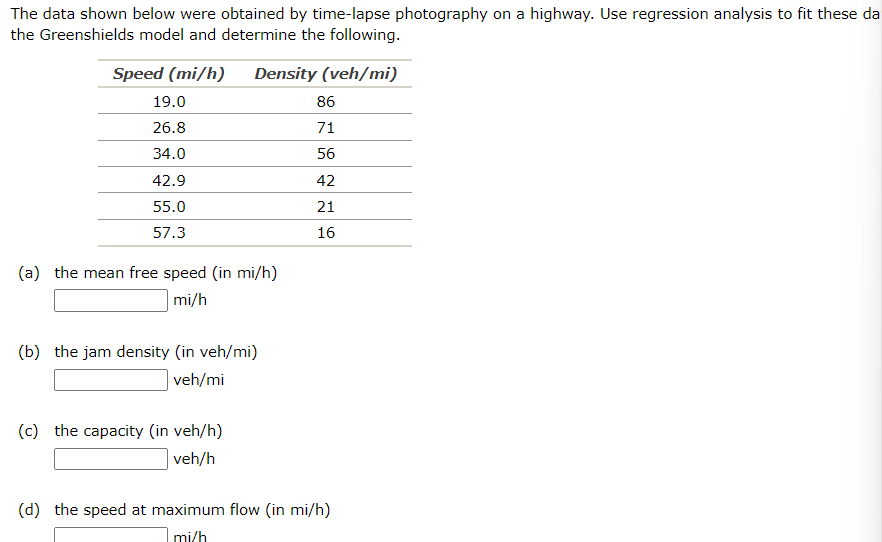
Question: The data shown below were obtained by time - lapse photography on a highway. Use regression analysis to fit these da the Greenshields model and
The data shown below were obtained by timelapse photography on a highway. Use regression analysis to fit these da
the Greenshields model and determine the following.
a the mean free speed in
b the jam density in vehmi
vehmi
c the capacity in vehh
vehh
d the speed at maximum flow in
Step by Step Solution
There are 3 Steps involved in it
1 Expert Approved Answer
Step: 1 Unlock

Question Has Been Solved by an Expert!
Get step-by-step solutions from verified subject matter experts
Step: 2 Unlock
Step: 3 Unlock