

Question: The data shown in following table are X and R values for 24 samples of size n=5 taken from a process producing. (1) Set up
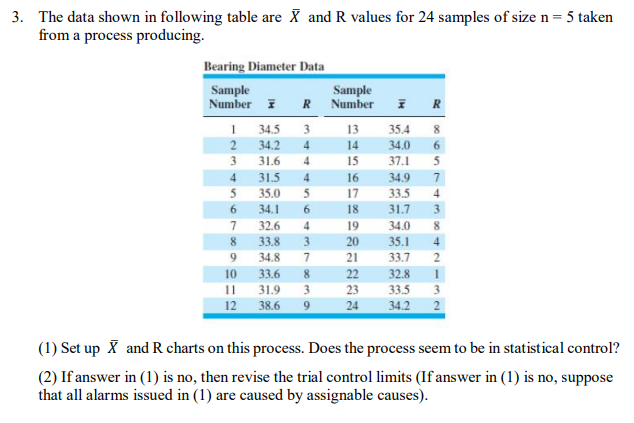
The data shown in following table are X and R values for 24 samples of size n=5 taken from a process producing. (1) Set up X and R charts on this process. Does the process seem to be in statistical control? (2) If answer in (1) is no, then revise the trial control limits (If answer in (1) is no, suppose that all alarms issued in (1) are caused by assignable causes)
Step by Step Solution
There are 3 Steps involved in it
1 Expert Approved Answer
Step: 1 Unlock

Question Has Been Solved by an Expert!
Get step-by-step solutions from verified subject matter experts
Step: 2 Unlock
Step: 3 Unlock