

Question: The data shown in table below are for ten samples of size 3. Sample Mean Range 1 8.58 5.06 2 11.52 2.85 3 8.70
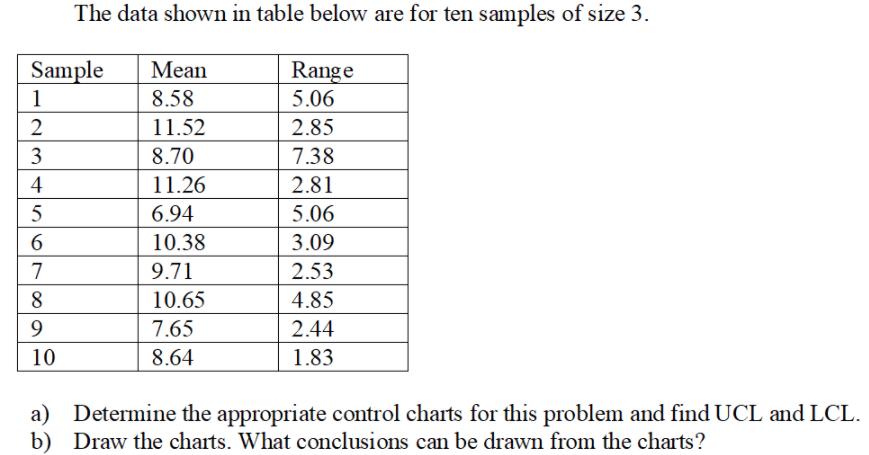
The data shown in table below are for ten samples of size 3. Sample Mean Range 1 8.58 5.06 2 11.52 2.85 3 8.70 7.38 4 11.26 2.81 6.94 5.06 6 10.38 3.09 7 9.71 2.53 8. 10.65 4.85 9. 7.65 2.44 10 8.64 1.83 a) Determine the appropriate control charts for this problem and find UCL and LCL. b) Draw the charts. What conclusions can be drawn from the charts?
Step by Step Solution
★★★★★
3.44 Rating (154 Votes )
There are 3 Steps involved in it
1 Expert Approved Answer
Step: 1 Unlock

Answer ER 379 R 379 9403 9403 O 379 freme chaut fey eorptante ... View full answer
Question Has Been Solved by an Expert!
Get step-by-step solutions from verified subject matter experts
Step: 2 Unlock
Step: 3 Unlock