

Question: The data shown in the following table were collected as part of a study in which the subjects were preterm infants with low birth weights
The data shown in the following table were collected as part of a study in which the subjects were preterm infants with low birth weights born in three different hospitals.
- Use dummy variable coding and multiple regression techniques to analyze these data.
- May we conclude that the three sam- ple hospital populations differ with respect to mean birth weight when gestational age is taken into account?
- May we conclude that there is interaction between hospital of birth and gestational age?
- Plot the original data and the fitted regression equations.
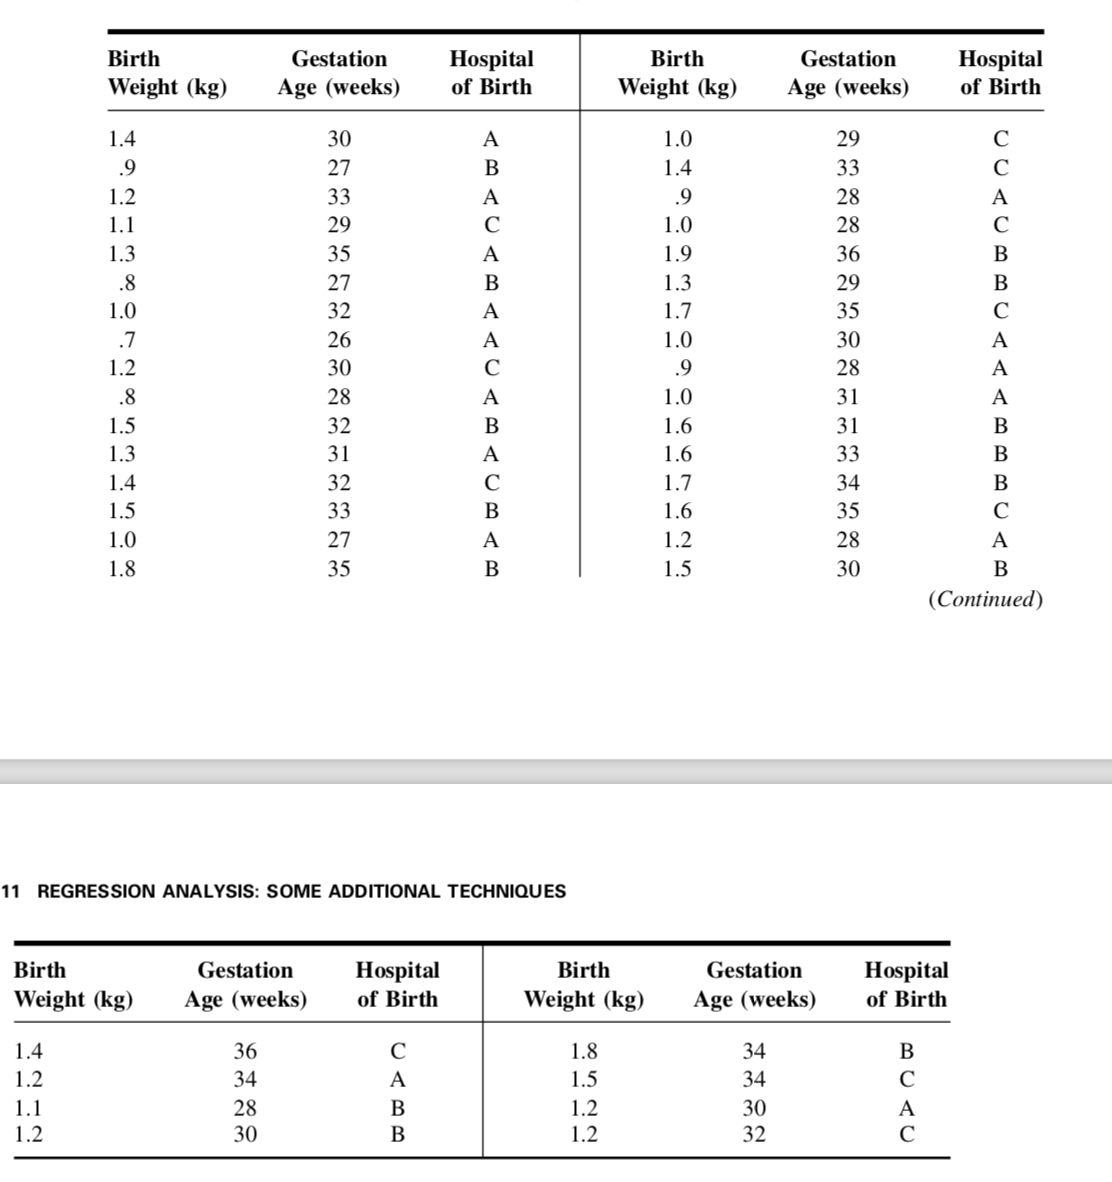
Birth Gestation Hospital Birth Gestation Hospital Weight (kg) Age (weeks) of Birth Weight (kg) Age (weeks) of Birth 1.4 30 A 1.0 29 C .9 27 B 1.4 33 C 1.2 33 A .9 28 A 1.1 29 C 1.0 28 C 1.3 35 A 1.9 36 B .8 27 B 1.3 29 B 1.0 32 A 1.7 35 C .7 26 A 1.0 30 A 1.2 30 C .9 28 A .8 28 A 1.0 31 A 1.5 32 B 1.6 31 B 1.3 31 A 1.6 33 B 1.4 32 C 1.7 34 B 1.5 33 B 1.6 35 C 1.0 27 A 1.2 28 A 1.8 35 B 1.5 30 B (Continued) 11 REGRESSION ANALYSIS: SOME AnomONAL TECHNIQUES Birth Gestation Hospital Birth Gestation Hospital Weight (kg) Age (weeks) of Birth Weight (kg) Age (weeks) of Birth 1.4 36 C 1.8 34 B 1.2 34 A 1.5 34 C 1.1 28 B 1.2 30 A 1.2 30 B 1.2 32 C
Step by Step Solution
There are 3 Steps involved in it

Get step-by-step solutions from verified subject matter experts