

Question: The data shown in the table in below are x and R values for 24 samples of size n = 5 taken from a process
The data shown in the table in below are x and Rvalues for 24 samples of size n = 5 taken from a process producing bearings (unit: mm). Based on the historic data, the mean and standard deviation of the bearing diameter are 33.275 mm and 1.9 mm. The measurements are made on the inside diameter of the bearing, with four decimals recorded (i.e., 34.5035).
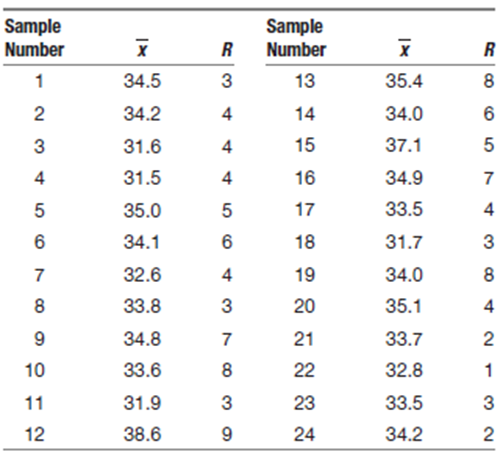
Set up x and Rcharts on this process using the 24 samples. Does the process seem to be in statistical control? Any points out of control? If necessary, revise the trial control limits.
\begin{tabular}{|c|c|c|c|c|c|} \hline \begin{tabular}{l} Sample \\ Number \end{tabular} & x & R & \begin{tabular}{l} Sample \\ Number \end{tabular} & x & R \\ \hline 1 & 34.5 & 3 & 13 & 35.4 & 8 \\ \hline 2 & 34.2 & 4 & 14 & 34.0 & 6 \\ \hline 3 & 31.6 & 4 & 15 & 37.1 & 5 \\ \hline 4 & 31.5 & 4 & 16 & 34.9 & 7 \\ \hline 5 & 35.0 & 5 & 17 & 33.5 & 4 \\ \hline 6 & 34.1 & 6 & 18 & 31.7 & 3 \\ \hline 7 & 32.6 & 4 & 19 & 34.0 & 8 \\ \hline 8 & 33.8 & 3 & 20 & 35.1 & 4 \\ \hline 9 & 34.8 & 7 & 21 & 33.7 & 2 \\ \hline 10 & 33.6 & 8 & 22 & 32.8 & 1 \\ \hline 11 & 31.9 & 3 & 23 & 33.5 & 3 \\ \hline 12 & 38.6 & 9 & 24 & 34.2 & 2 \\ \hline \end{tabular}
Step by Step Solution
There are 3 Steps involved in it

Get step-by-step solutions from verified subject matter experts