

Question: The data table shown below represents experimentally determined values of flow rate (Q in cps) versus height of mercury (see Figure 1). for a particular
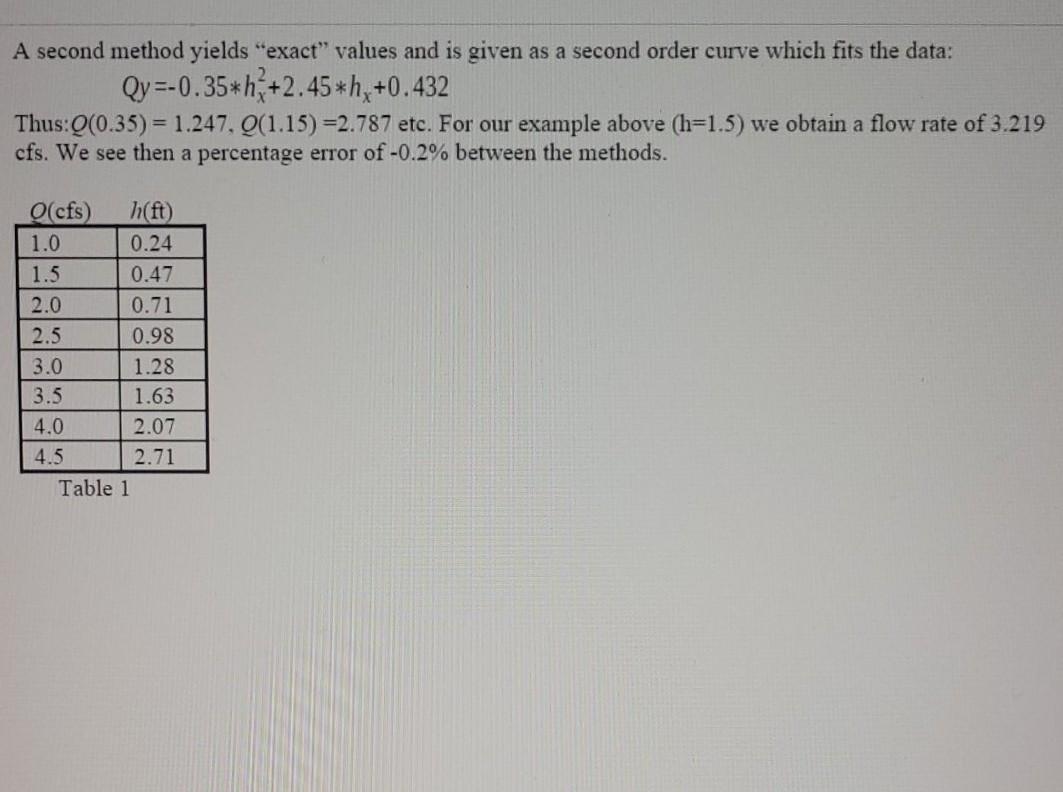
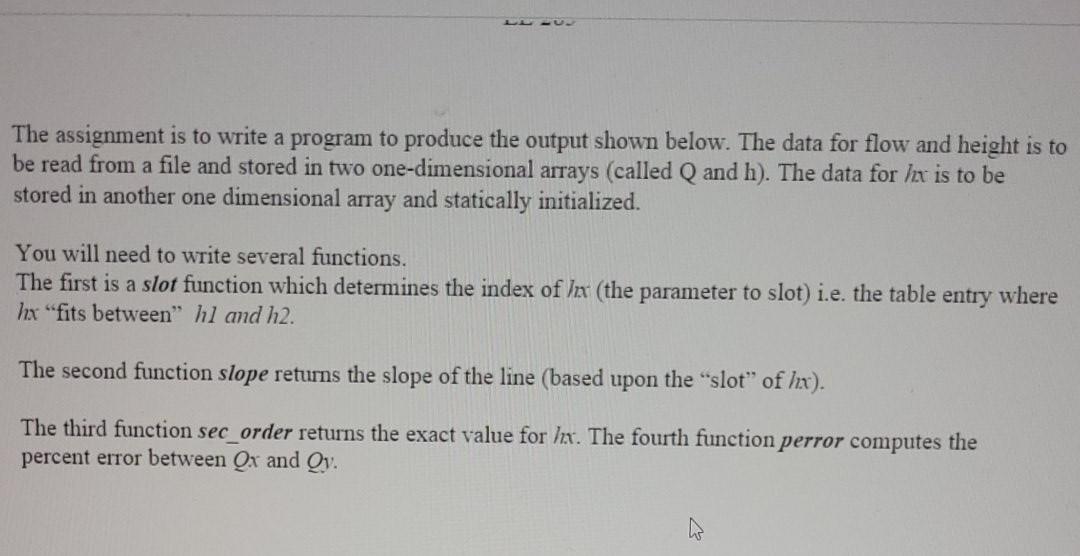
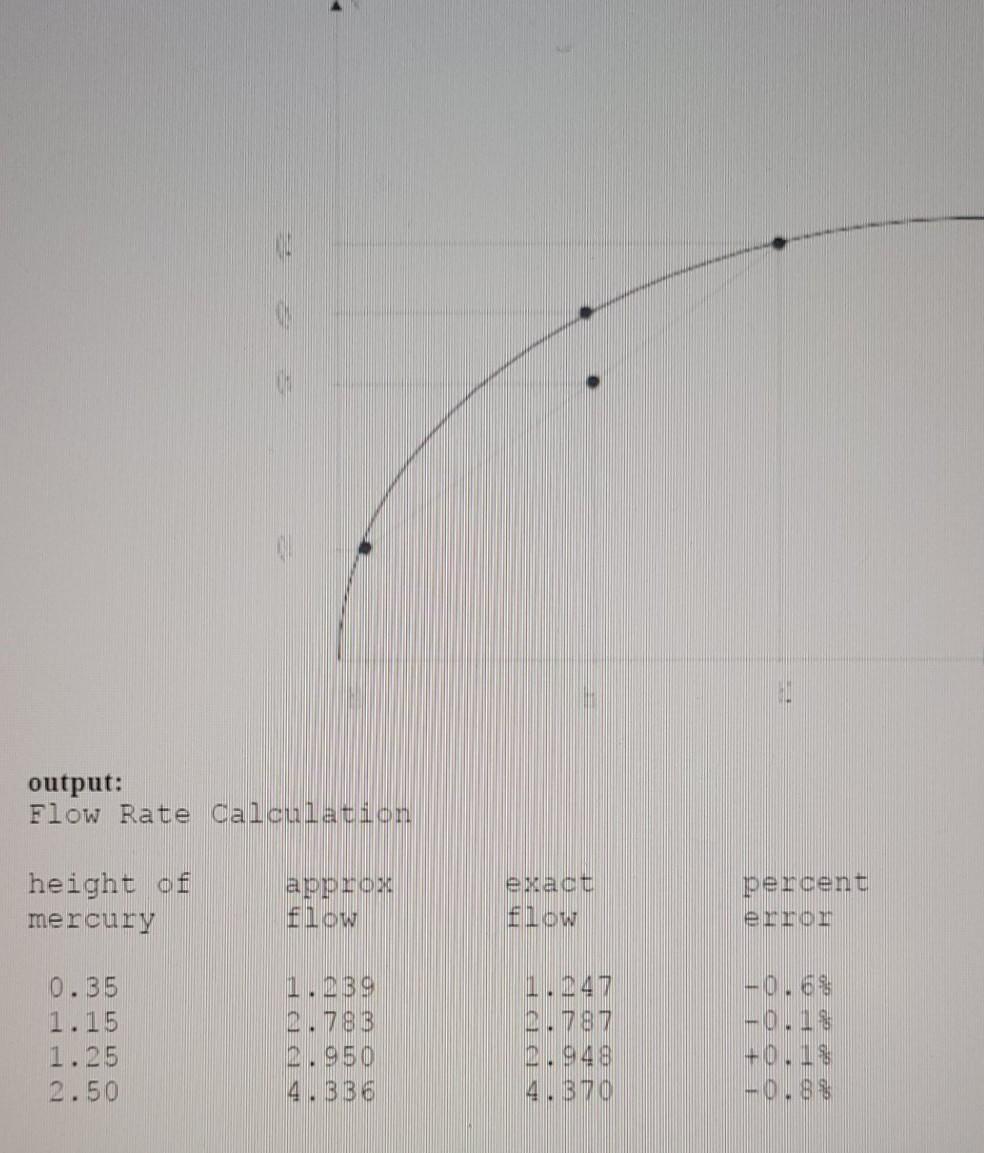
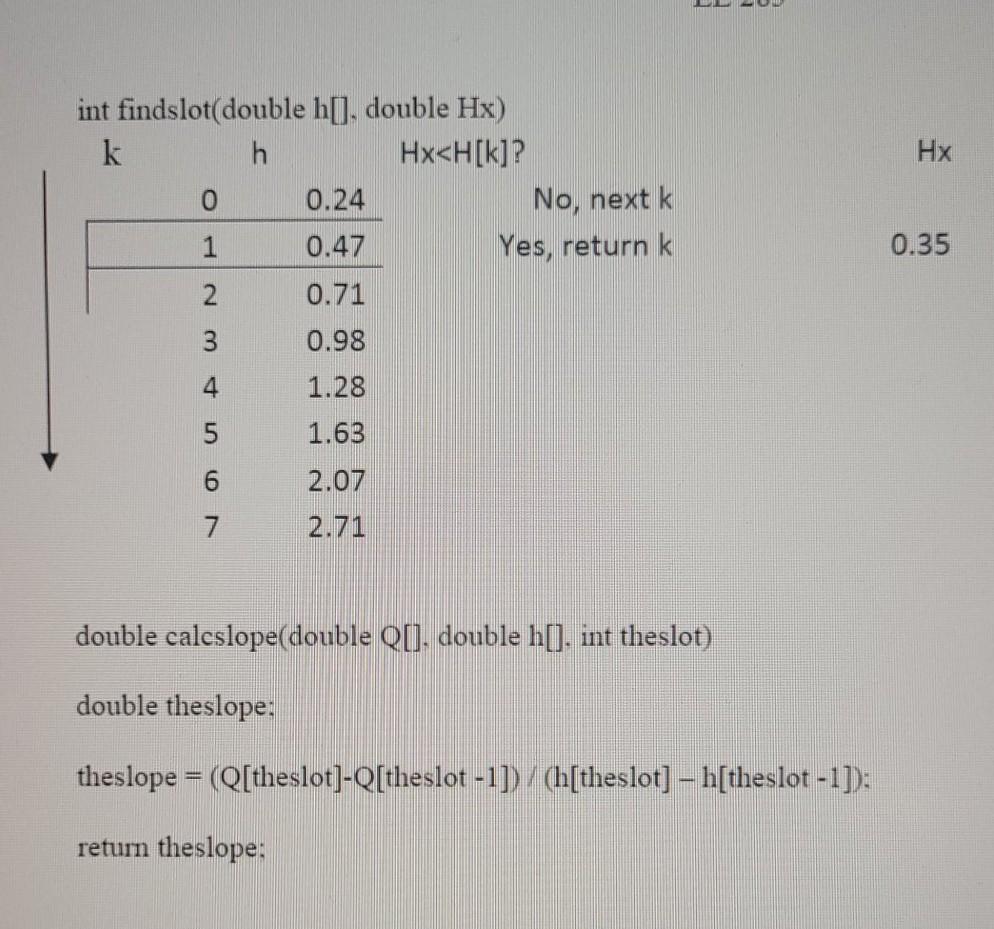
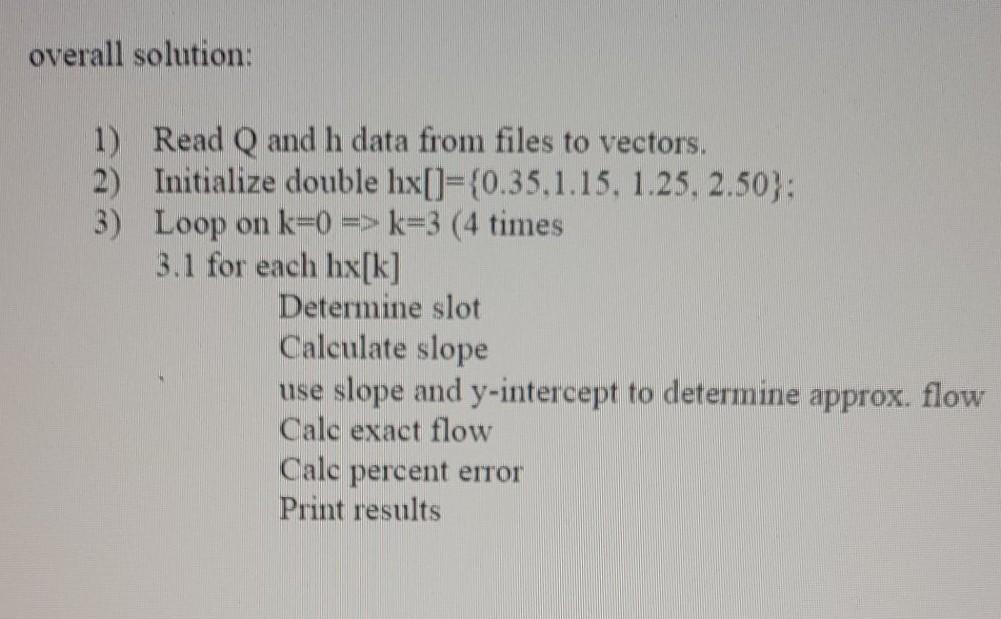
The data table shown below represents experimentally determined values of flow rate (Q in cps) versus height of mercury (see Figure 1). for a particular nozzle orifice. Figure 1 Experimental Setup Given a measured height, the table can be used to obtain the flow rate. However, if the measured height is "in between the li values we may still be able to approximate 9. The method of approximation is called linear interpolation and proceeds as follows: let hl be the height just below the measured height ha h2 above Q1 correspond to the flow rate at hl slopez02-01 h2-h1 Qx=slopex hx -h1+Q1 So, for example, a height of 1.5 ft, falls in between 1.28 and 1.63. with corresponding flow rates of 3.0 and 3.5 respectively. So hl is 1.28 and Q1 is 3.0. and our slope is 1.429. Thus the "approximate flow rate is 3.314 (cfs). A second method yields "exact" values and is given as a second order curve which fits the data: Qy=-0.35*h*+2.45 *h +0.432 Thus:(0.35) = 1.247. O(1.15)=2.787 etc. For our example above (h=1.5) we obtain a flow rate of 3.219 cfs. We see then a percentage error of -0.2% between the methods. O(cfs) h(ft) 1.0 0.24 0.47 2.0 0.71 2.5 0.98 3.0 1.28 3.5 1.63 4.0 2.07 4.5 2.71 Table 1 - The assignment is to write a program to produce the output shown below. The data for flow and height is to be read from a file and stored in two one-dimensional arrays (called Q and h). The data for hx is to be stored in another one dimensional array and statically initialized. You will need to write several functions. The first is a slot function which determines the index of /zx (the parameter to slot) i.e. the table entry where hx "fits between" hl and h2. The second function slope returns the slope of the line (based upon the "slot of lx). The third function sec_order returns the exact value for lx. The fourth function perror computes the percent error between Qx and Ov. output: Flow Rate Calculation height of mercury appro flow ea Low percent em 1.239 2.788 2.787 0.35 1.15 1.25 2.50 - 0.6% -0.14 +0.1% -0.89 4.336 4.70 Hx int findslot(double h[], double Hx) k h Hx
Step by Step Solution
There are 3 Steps involved in it

Get step-by-step solutions from verified subject matter experts