

Question: The Data The data in the report are all reported in the millions ( 0 0 0 , 0 0 0 s ) and interpreted
The Data
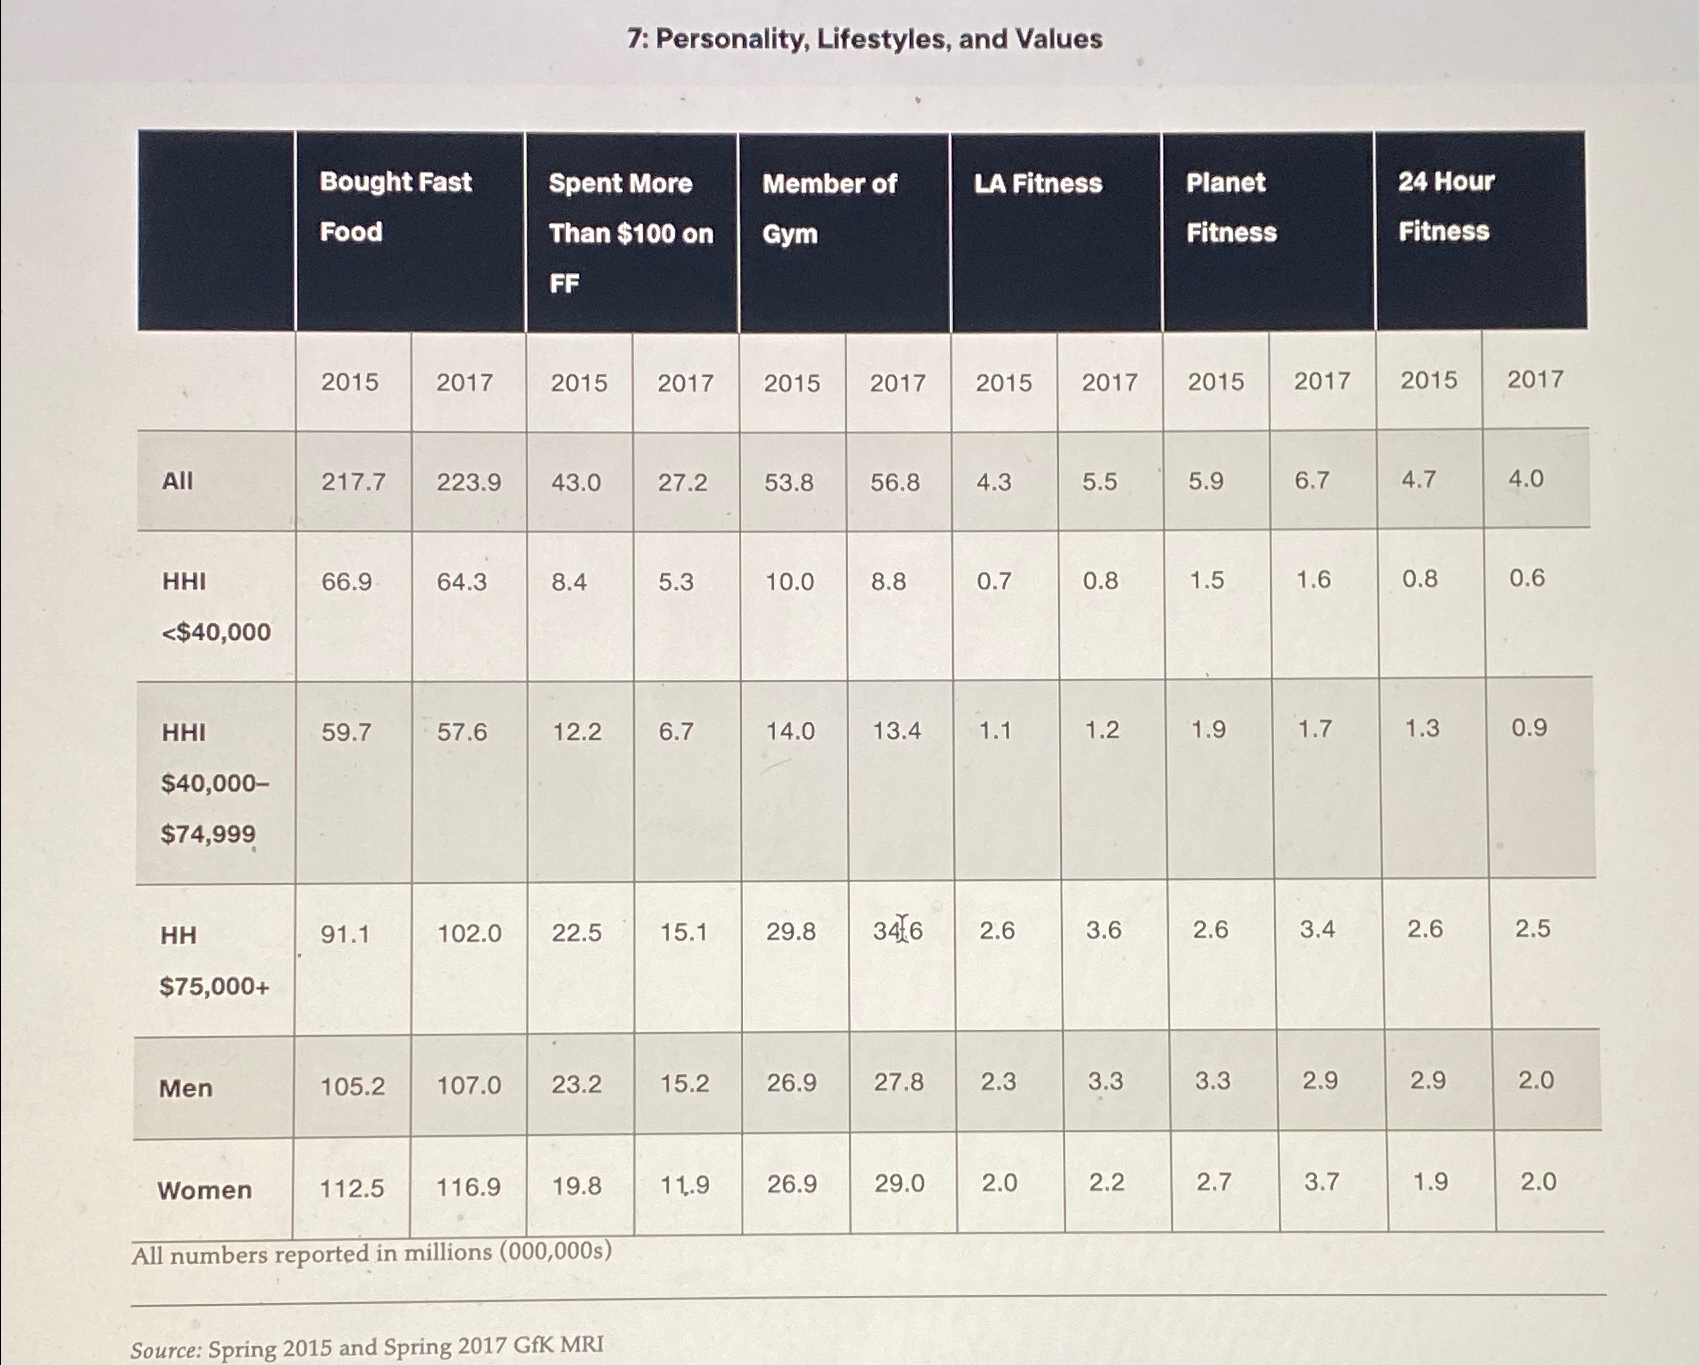
The data in the report are all reported in the millions and interpreted in a similar way:
"Bought Fast Food" and "Spent More than $ on : Both questions deal with someone's fastfood consumption in the past six months from either Spring or Spring The first question is a simple count of whether someone spent any money on fast food, whereas the second question estimates the number of people who spent more than $ on fast food in the past six months.
"Member of Gym": This question is an estimate of US adults who have had a membership in any sort of fitness gym in the last months from either Spring or Spring This number includes any gym, not just Hour Fitness, Planet Fitness, and LA Fitness.
LA Fitness", Hour Fitness", and "Planet Fitness": These questions are the estimated count of US adults who had a membership to the gym within the last months from either Spring or Spring
Which of the three income groups had the largest increase in gym membership from to If this was expressed in terms of percentage increase, which income group experienced the largest increase from to
Which of the three gyms had the largest market share in In
From to does it appear that LA Fitness, Hour Fitness, and Planet Fitness comprise a greater or lesser share of the total gym membership market? Why?
: Personality, Lifestyles, and Values
All numbers reported in millions
Source: Spring and Spring GfK MRI
Step by Step Solution
There are 3 Steps involved in it
1 Expert Approved Answer
Step: 1 Unlock

Question Has Been Solved by an Expert!
Get step-by-step solutions from verified subject matter experts
Step: 2 Unlock
Step: 3 Unlock