

Question: The data to the right compare the on-time arrival performance of two airlines, X and Y. The table shows the status of 15,080 arrivals Airline
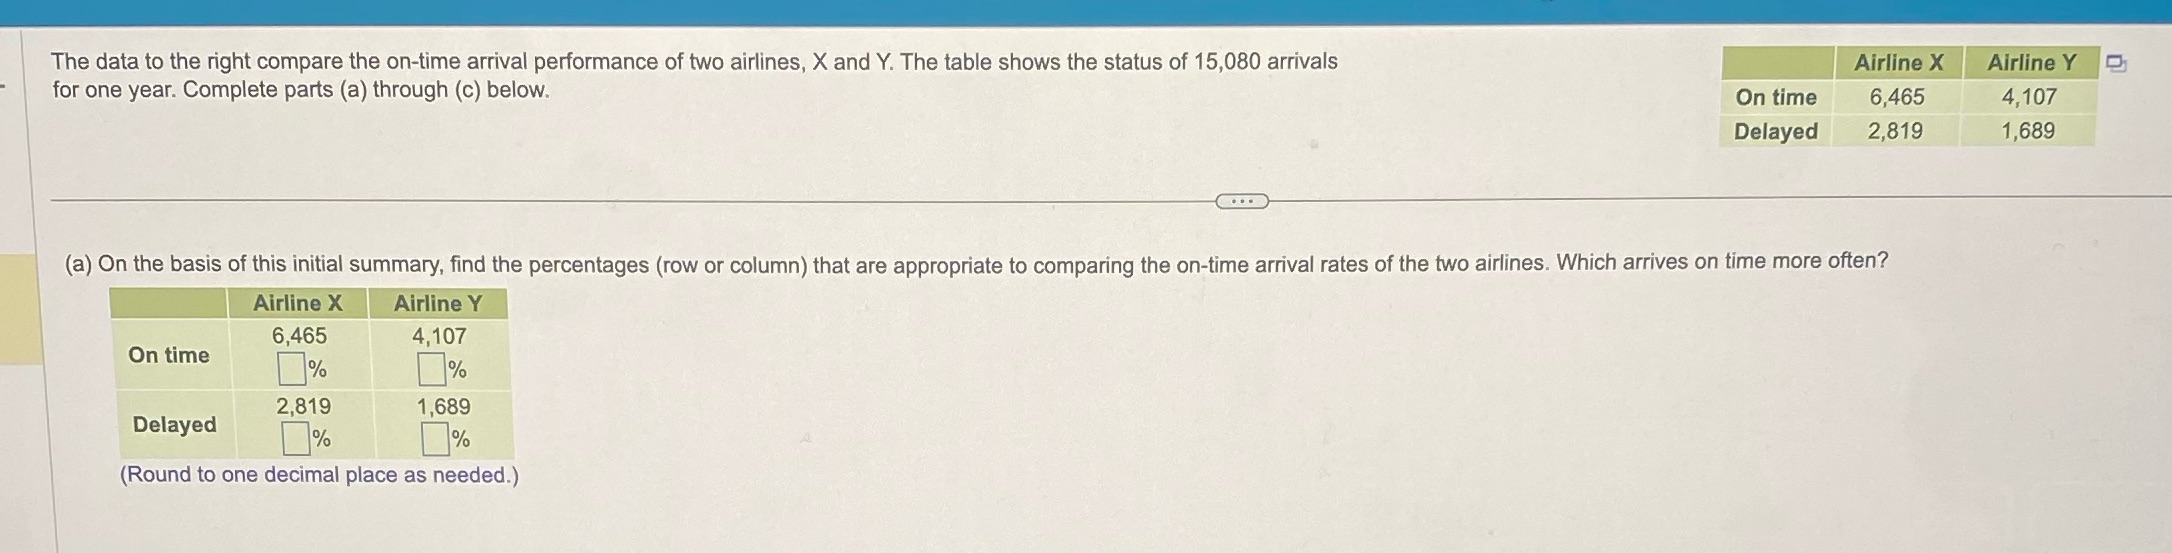
The data to the right compare the on-time arrival performance of two airlines, X and Y. The table shows the status of 15,080 arrivals Airline X Airline Y for one year. Complete parts (a) through (c) below. On time 6,465 4, 107 Delayed 2,819 1,689 (a) On the basis of this initial summary, find the percentages (row or column) that are appropriate to comparing the on-time arrival rates of the two airlines. Which arrives on time more often? Airline X Airline Y 6,465 4,107 On time % % 2,819 1,689 Delayed % % (Round to one decimal place as needed.)
Step by Step Solution
There are 3 Steps involved in it
1 Expert Approved Answer
Step: 1 Unlock

Question Has Been Solved by an Expert!
Get step-by-step solutions from verified subject matter experts
Step: 2 Unlock
Step: 3 Unlock