

Question: The data to the right compare the on-time arrival performance of two airlines, X and Y. The table shows the status of 14,494 arrivals
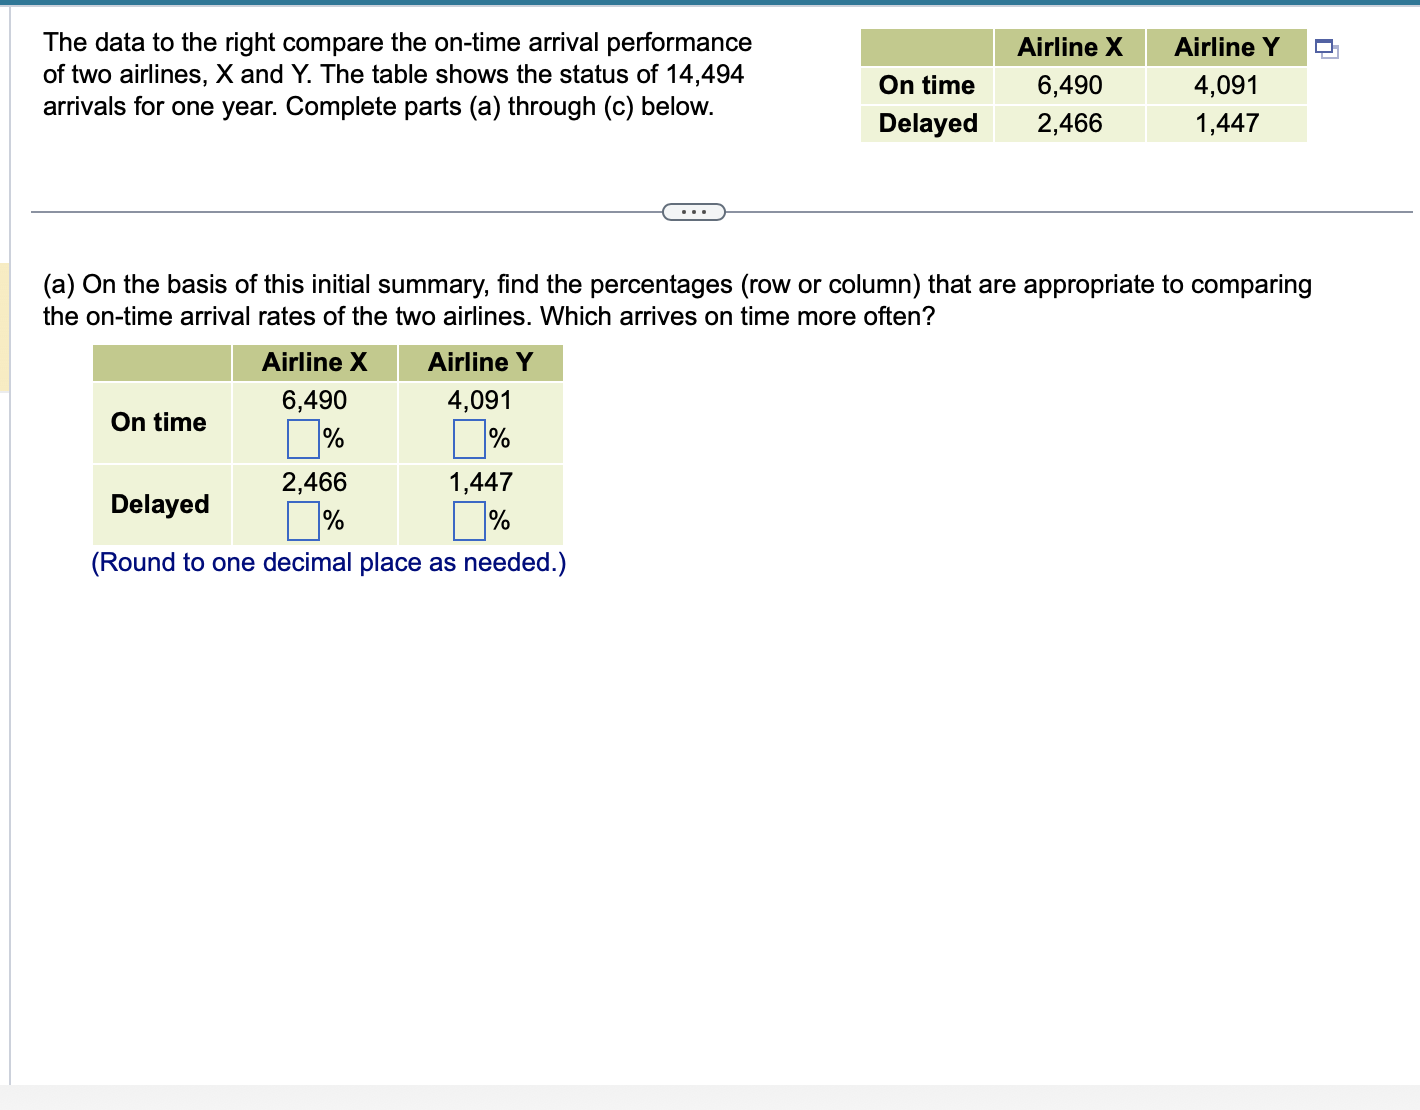
The data to the right compare the on-time arrival performance of two airlines, X and Y. The table shows the status of 14,494 arrivals for one year. Complete parts (a) through (c) below. ... Airline X Airline Y On time Delayed 6,490 4,091 2,466 1,447 (a) On the basis of this initial summary, find the percentages (row or column) that are appropriate to comparing the on-time arrival rates of the two airlines. Which arrives on time more often? Airline X 6,490 Airline Y 4,091 On time % % 2,466 1,447 Delayed % % (Round to one decimal place as needed.)
Step by Step Solution
There are 3 Steps involved in it

Get step-by-step solutions from verified subject matter experts