

Question: The dataset you will use is a CSV file that contains housing data collected from the 1990 California census. You can find this dataset
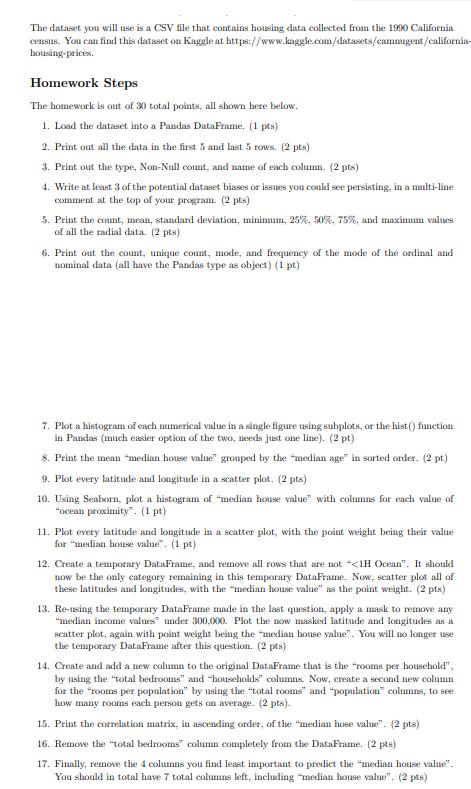
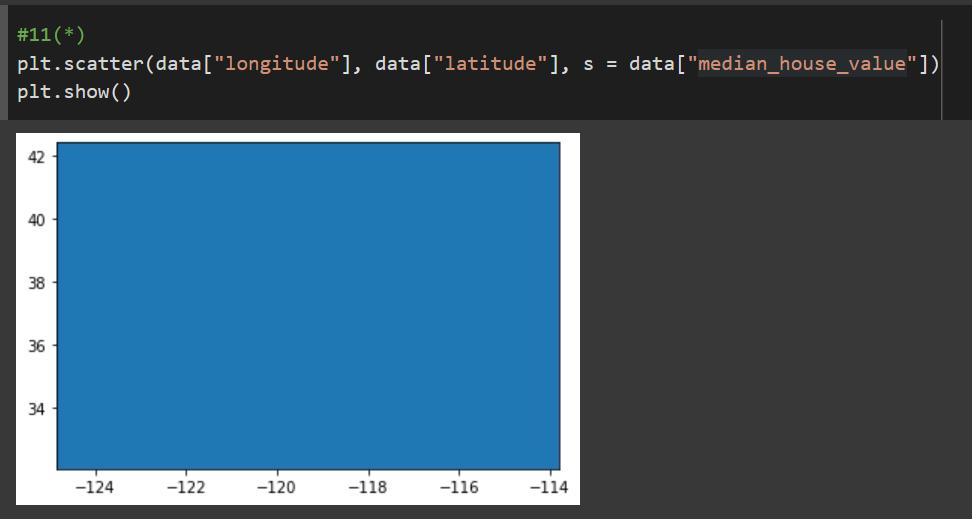
The dataset you will use is a CSV file that contains housing data collected from the 1990 California census. You can find this dataset on Kaggle at https://www.kaggle.com/datasets/cammugent/california- housing-prices. Homework Steps The homework is out of 30 total points, all shown here below. 1. Load the dataset into a Pandas DataFrame. (1 pts) 2. Print out all the data in the first 5 and last 5 rows. (2 pts) 3. Print out the type, Non-Null count, and name of each column. (2 pts) 4. Write at least 3 of the potential dataset biases or issues you could see persisting, in a multi-line comment at the top of your program. (2 pts) 5. Print the count, mean, standard deviation, minimum, 25%, 50%, 75%, and maximum values of all the radial data. (2 pts) 6. Print out the count, unique count, mode, and frequency of the mode of the ordinal and nominal data (all have the Pandas type as object) (1 pt) 7. Plot a histogram of each numerical value in a single figure using subplots, or the hist() function in Pandas (much easier option of the two, needs just one line). (2 pt) 8. Print the mean "median house value" grouped by the "median age" in sorted order. (2 pt) 9. Plot every latitude and longitude in a scatter plot. (2 pts) 10. Using Seaborn, plot a histogram of "median house value with columns for each value of "ocean proximity". (1 pt) 11. Plot every latitude and longitude in a scatter plot, with the point weight being their value for "median house value". (1 pt) 12. Create a temporary DataFrame, and remove all rows that are not
Step by Step Solution
3.38 Rating (157 Votes )
There are 3 Steps involved in it
Solution 1 Load the dataset into a Pandas DataFrame import pandas as pd data pdreadcsvcaliforniahousingpricescsv 2 Print out all the data in the first 5 and last 5 rows printdatahead printdatatail 3 P... View full answer

Get step-by-step solutions from verified subject matter experts